. 2008 May;40(5):650-5.
doi: 10.1038/ng.117. Epub 2008 Apr 13.

No evidence of clonal somatic genetic alterations in cancer-associated fibroblasts from human breast and ovarian carcinomas

Affiliations

No evidence of clonal somatic genetic alterations in cancer-associated fibroblasts from human breast and ovarian carcinomas

Wen Qiu et al. Nat Genet. 2008 May.

Abstract

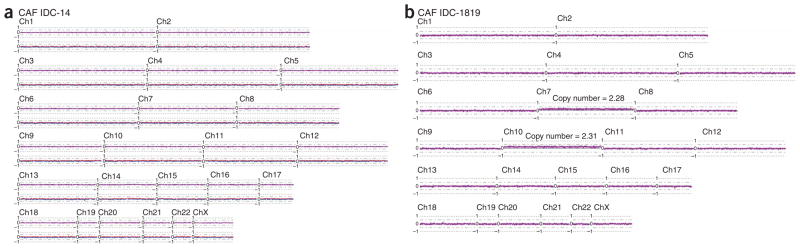
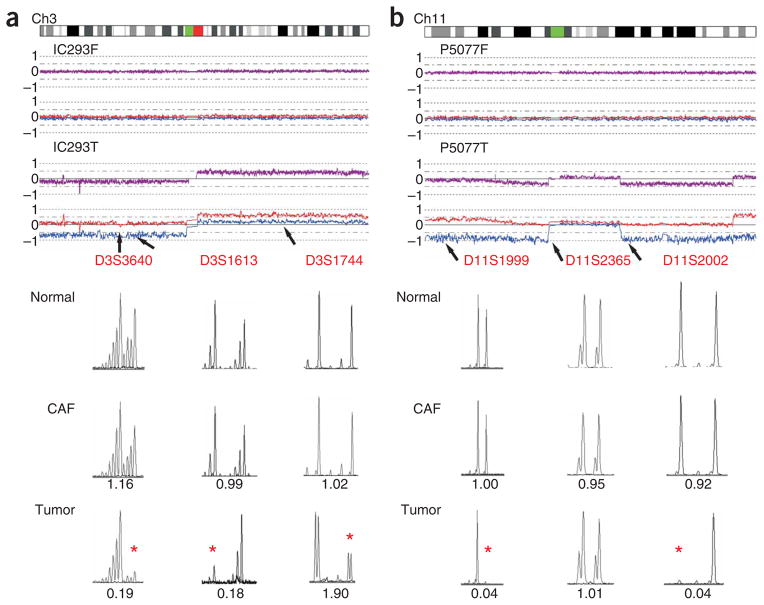
There is increasing evidence showing that the stromal cells surrounding cancer epithelial cells, rather than being passive bystanders, might have a role in modifying tumor outgrowth. The molecular basis of this aspect of carcinoma etiology is controversial. Some studies have reported a high frequency of genetic aberrations in carcinoma-associated fibroblasts (CAFs), whereas other studies have reported very low or zero mutation rates. Resolution of this contentious area is of critical importance in terms of understanding both the basic biology of cancer as well as the potential clinical implications of CAF somatic alterations. We undertook genome-wide copy number and loss of heterozygosity (LOH) analysis of CAFs derived from breast and ovarian carcinomas using a 500K SNP array platform. Our data show conclusively that LOH and copy number alterations are extremely rare in CAFs and cannot be the basis of the carcinoma-promoting phenotypes of breast and ovarian CAFs.


Figures

Figure 1
Figure 1
Examples of manual microdissection from hematoxylin and eosin stained sections. (a,b) Serous ovarian cancer IC131 (a) and breast medullary carcinoma P5077 (b) shown before and after microdissection. The tumor epithelial cells (T) and CAFs (F) that were within 5 mm distance from tumor epithelia were microdissected and analyzed with 500K SNP arrays and MSMs. Scale bar, 5 mm in a; 2 mm in b.
Figure 2
Figure 2
Genome-wide copy number and LOH analysis plot of different cell types within medullary breast cancer sample P5077. DNA of epithelial and stromal cell components were independently analyzed on 500K SNP arrays, and the results were normalized to corresponding normal blood DNA. Purple line is a plot of a 20-SNP moving average of the log2 copy number ratios. Blue and red lines represent allele-specific log2 copy numbers with a value of 0 being equivalent to 1 copy, and a value of –1 equivalent to complete loss of the allele. Note the region of copy number–neutral LOH on chromosome 3p in tumor P5077T (black arrow) as indicated by a near diploid copy number (purple line), whereas the allele-specific copy number shows loss of one allele and a corresponding gain of the other allele. (a) Epithelial cells. (b) Fibroblasts.
Figure 3
Figure 3
Genome-wide copy number and LOH analysis plot of different cell types within serous ovarian cancer sample IC131. Analysis and labeling were done as in Figure 2. (a) Epithelial cells. (b) Fibroblasts.
Figure 4
Figure 4
Allelic imbalance analysis of chromosome 22 in fibroblast and epithelial foci of ovarian cancer sample IC307. (a) Copy number plot of chromosome 22 in tumor epithelial (T1) and fibroblast DNA (F1a) visualized using CNAG. Note that the small region of amplification in the epithelia (indicated by black arrow) is absent from the F1a component. (b) Hematoxylin and eosin–stained section of the original microdissected block 1 showing one tumor epithelia (T1) and two CAF regions (F1a and F1b) included in this study. Note that T1 and F1a were analyzed with both SNP chips and two chromosome 22 MSMs. CAF region F1b was analyzed with MSMs only. (c) Hematoxylin and eosin–stained section of an independent frozen block shows examples of additional regions of tumor epithelia and CAF samples used for microsatellite analysis. (d) Allelic imbalance analysis of DNA extracted from the microdissected tumor and CAF regions illustrated in b and c using D22S1169 MSM. Both analyzed tumor foci (T1 and T2) showed loss of the larger allele (indicated by red arrow). Three analyzed CAFs (F1a, F1b and F2b) showed loss of the smaller allele (illustrated by red asterisk). The other analyzed CAF (F2a) retained heterozygosity, compared with matching normal DNA (see ‘Normal’ panel, left chromatogram). The allelic imbalance ratio for each tumor and stroma is shown under each chromatogram. Scale bar, 2 mm in b; 5 mm in c.
Figure 5
Figure 5
Genome-wide copy number plots and LOH plot of two primary breast CAFs. DNA of both primary cultured fibroblasts was analyzed on the 250K NspI SNP array. (a) CAFs IDC-14 shows that both the overall copy number (purple line) and the allele-specific copy number values (blue and red lines) seem to be normal. (b) CAFs IDC-1819 shows approximately 0.2 (log2 scale) of copy number gain across whole chromosome 7 and 10 with the estimated copy number (2.28 and 2.31, respectively) in linear scale across entire chromosome shown. Only the smoothed overall copy number plot is shown (purple line) for IDC-1819 because of the absence of its matching normal.
Figure 6
Figure 6
Assessment of allelic imbalance at stroma-specific mutation hot spots in ovarian cancer sample IC293 and breast cancer sample P5077. The CNAG copy number plots of the 500K SNP array data for the tumor and fibroblast components are shown at the top of each figure, and the MSM chromatograms are shown below. Locations of the MSMs relative to the CNAG plot are indicated by arrows. The allelic imbalance ratio for each tumor and stroma sample was calculated in comparison with corresponding normal DNA and is listed under each chromatogram. Allelic imbalance is considered significant when the allelic imbalance ratio was ≤0.67 or ≥1.5 (indicated by red asterisk). (a) Allelic imbalance analysis of ovarian cancer sample IC293 using three chromosome 3 MSMs: D3S3640, D3S1613 and D3S1744. Allelic imbalance is evident in the tumor component for all 3 MSMs, which is consistent with the SNP array data. There is no evidence of allelic imbalance in the fibroblast preparations with any MSMs. (b) Allelic imbalance analysis of breast cancer 5077 using three chromosome l1 MSMs: D11S1999, D11S2365 and D11S2002. The tumor component shows allelic imbalance with MSMs D11S1999 and D11S2002, but retention of heterozygosity with D11S2365 that is consistent with the prediction of 500K SNP array data (see allele-specific copy number plot, blue and red lines). There is no evidence of allelic imbalance in the fibroblast samples with any MSMs.

Comment in

Similar articles

Cited by

References

    1. Maffini MV, Soto AM, Calabro JM, Ucci AA, Sonnenschein C. The stroma as a crucial target in rat mammary gland carcinogenesis. J Cell Sci. 2004;117:1495–1502. - PubMed
    1. Olumi AF, et al. Carcinoma-associated fibroblasts direct tumor progression of initiated human prostatic epithelium. Cancer Res. 1999;59:5002–5011. - PMC - PubMed
    1. Orimo A, et al. Stromal fibroblasts present in invasive human breast carcinomas promote tumor growth and angiogenesis through elevated SDF-1/CXCL12 secretion. Cell. 2005;121:335–348. - PubMed
    1. Orimo A, Weinberg RA. Stromal fibroblasts in cancer: a novel tumor-promoting cell type. Cell Cycle. 2006;5:1597–1601. - PubMed
    1. Grum-Schwensen B, et al. Suppression of tumor development and metastasis formation in mice lacking the S100A4(mts1) gene. Cancer Res. 2005;65:3772–3780. - PubMed

Publication types