. 2008 May;5(5):417-23.
doi: 10.1038/nmeth.1202. Epub 2008 Apr 13.

Live-cell photoactivated localization microscopy of nanoscale adhesion dynamics

Affiliations

Live-cell photoactivated localization microscopy of nanoscale adhesion dynamics

Hari Shroff et al. Nat Methods. 2008 May.

Abstract

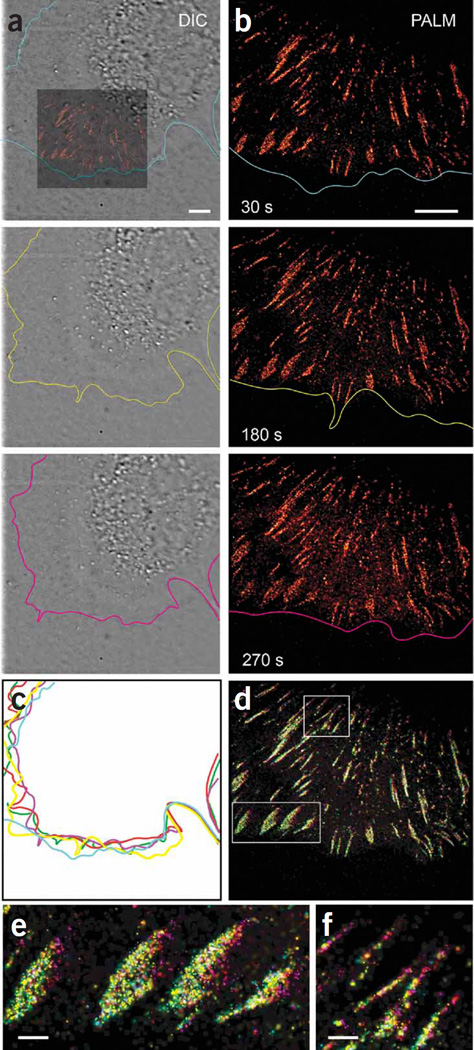
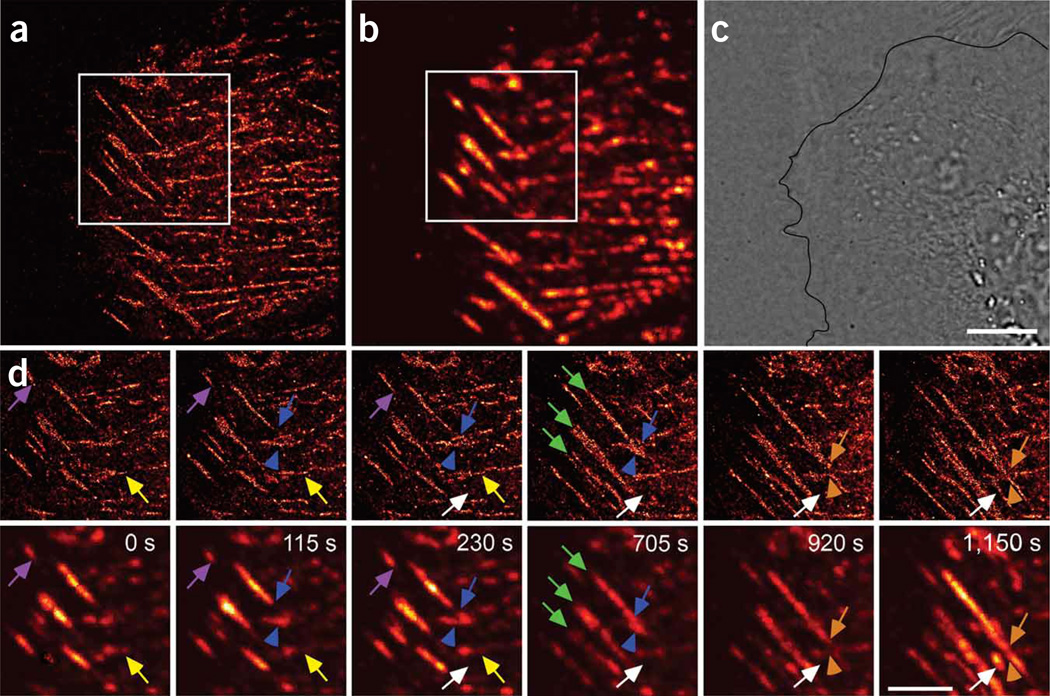
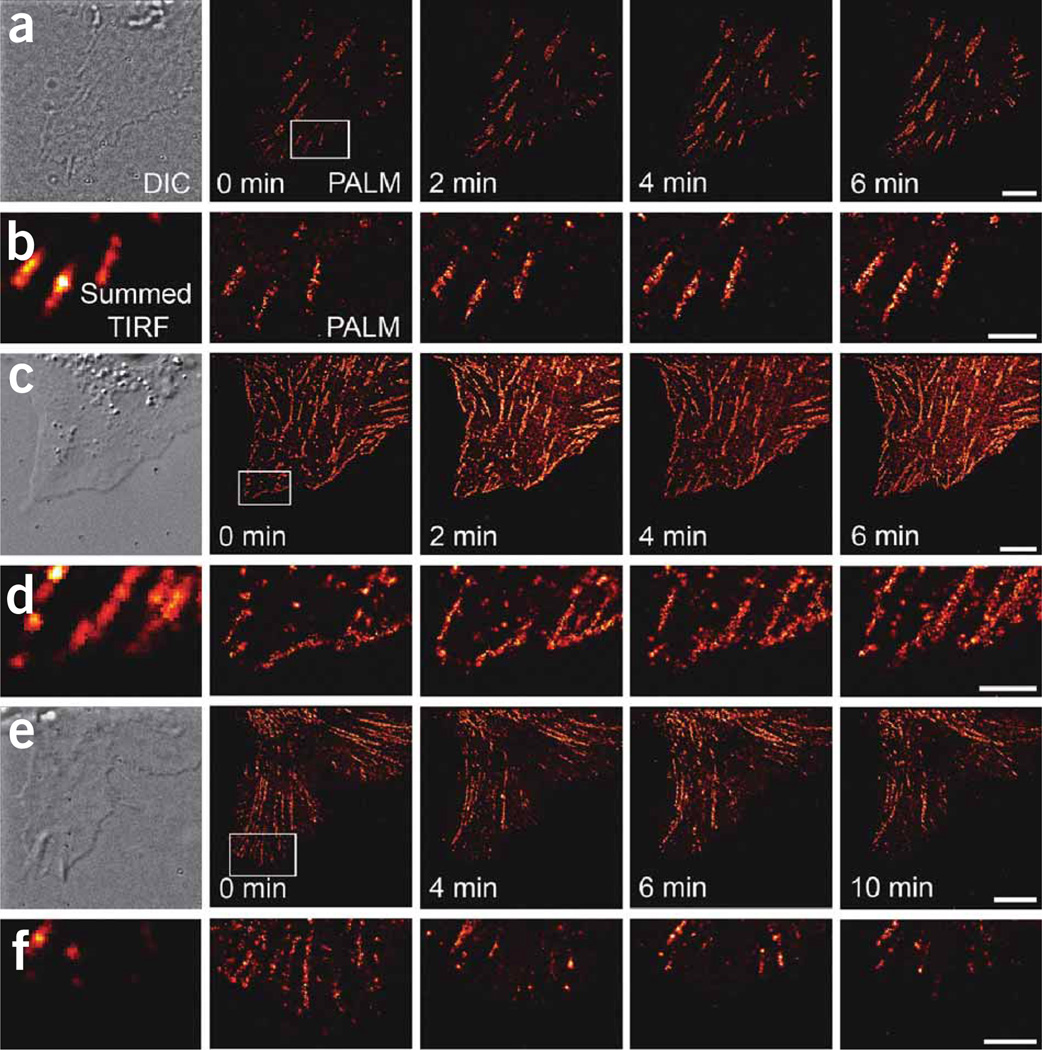
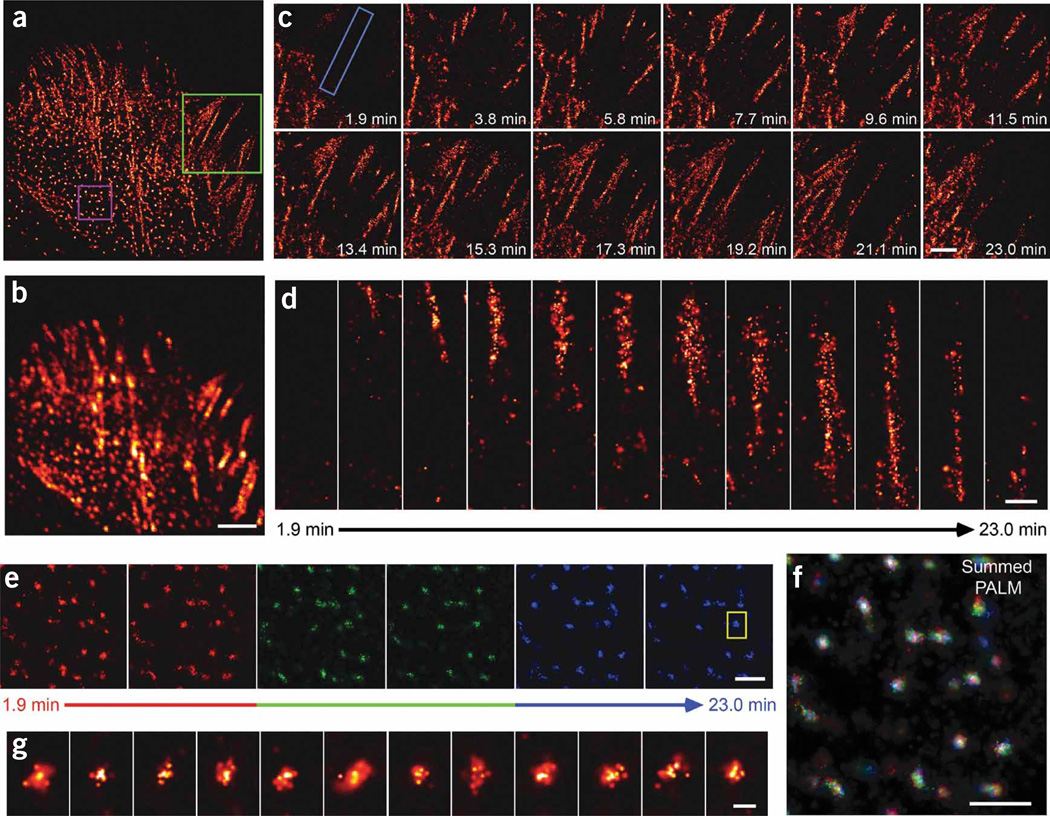
We demonstrate live-cell super-resolution imaging using photoactivated localization microscopy (PALM). The use of photon-tolerant cell lines in combination with the high resolution and molecular sensitivity of PALM permitted us to investigate the nanoscale dynamics within individual adhesion complexes (ACs) in living cells under physiological conditions for as long as 25 min, with half of the time spent collecting the PALM images at spatial resolutions down to approximately 60 nm and frame rates as short as 25 s. We visualized the formation of ACs and measured the fractional gain and loss of individual paxillin molecules as each AC evolved. By allowing observation of a wide variety of nanoscale dynamics, live-cell PALM provides insights into molecular assembly during the initiation, maturation and dissolution of cellular processes.


Figures

Figure 1
Figure 1
Factors influencing spatial resolution in live-cell PALM. (a) Resolution versus the density of localized molecules, represented here as pixels in a test pattern. Features are imaged at progressively lower signal-to-noise ratio as the molecular density decreases and become unresolvable when the mean molecular separation approaches the feature size. As more time is required to localize more molecules, this illustration implies a fundamental trade-off between spatial and temporal resolution in PALM. (b) Resolution versus feature motion. The serial, stochastic acquisition process in PALM leads to another such trade-off: the resolution limit for dynamically evolving features is comparable to the product of the feature velocity and the frame acquisition time.
Figure 2
Figure 2
Nonperturbative live-cell PALM. (a) DIC images from a time series (Supplementary Video 1) of an NIH 3T3 cell expressing tdEos-paxillin during 5 min of continuous PALM imaging. Colored inset indicates relative position of PALM image in b. Colored contours highlight the cell edge. (b) PALM images (Supplementary Video 2; middle panel) constructed from 750 single-molecule images (30 s total duration) and ending at indicated time points. (c) Overlay of cell-edge contours shows continuous movement at the leading edge during imaging. Colors correspond to labels in a and b, with red and green indicating 90 and 120 s, respectively. (d) Composite time-summed PALM image. Five PALM images corresponding to the contours in c were similarly pseudocolored and summed to provide a color map indicating the period when each tdEosFP-paxillin molecule was visualized. Molecules appeared continuously at the front of ACs (all colors), but molecules were visualized at the back of the AC only at later time points (purple). Scale bars, 5 µm. (e,f) Higher-magnification view of boxed regions in d. Scale bars, 1 µm.
Figure 3
Figure 3
Live-cell PALM allows extended observations at high resolution and over a wide range of molecular density. (ac) PALM (a), summed TIRF (b; Supplementary Video 3) and DIC (c) images of a CHO cell expressing tdEos-paxillin, imaged for >20 min. (d) Higher-magnification views of boxed regions in a (top row) and b (bottom row) showing predominantly horizontal and stationary adhesions (yellow arrows) and diagonal inwardly moving adhesions (purple arrows). Intersecting adhesions either interacted weakly (orange arrows and arrowheads) or the moving AC bends the stationary AC (blue arrows and arrowheads). Features that appeared homogeneous in summed TIRF microscopy were revealed at their true size with substantially greater internal detail by PALM (green arrows). PALM also revealed nascent adhesions initially not seen by summed TIRF microscopy that arose in the cell interior (white arrows). Indicated times are final time points of each 60-s acquisition, with the first time in the image series set to 0 s. Scale bars, 5 µm.
Figure 4
Figure 4
Paxillin flow to and from ACs. (af) Selected live-cell PALM images (a,c,e; scale bars, 5 µm) and higher-magnification views (b,d,f; scale bars, 2 µm) of boxed regions of tdEos-paxillin distributions in several cells. DIC and summed TIRF microscopy images are shown at left. The NIH 3T3 cell in a,b and Supplementary Video 4 showed inward AC motion (upward, toward the cell center) but no new AC formation at the cell periphery, similar to the adhesions we observed in 12 additional cells (data not shown). In contrast, the CHO cell in c,d and Supplementary Video 5 displayed inward motion and a constant replenishment of paxillin molecules at the cell edge, typical of the adhesions in 8 additional cells we observed (data not shown). The NIH 3T3 cell in e,f retracted with a resulting dissolution of ACs (Supplementary Video 6), similar to the dissolving ACs we observed in 8 additional cells (data not shown). Indicated times are final time points of each 30 s acquisition (a,b) or 60 s acquisition (cf), with the first time in the image series set to 0 s.
Figure 5
Figure 5
A diversity of AC dynamics in a single cell. (a,b) PALM (a) and summed TIRF microscopy (b) images of a CHO cell expressing tdEos-paxillin from a 23-min time series (Supplementary Video 7). Scale bar, 5 µm. (c) Higher magnification of the green-boxed region in a to illustrate AC initiation and elongation. Note the established ACs at lower left in addition to paxillin molecules that are less well organized in regions at upper right. Scale bar, 3 µm. (d) Higher magnification of a single AC (boxed region in c) to visualize molecular organization during the elongation process. Scale bar, 0.5 µm. (eg) The motion of subdiffractive ACs (magenta box in a) is highlighted in the time series. The initial, middle and late frames in e were colored red, green and blue, and then added to create the time-summed pseudocolor image in f. Scale bars, 0.5 µm. The mostly white central cores in f, the higher magnification view of the single AC (g; close-up of boxed region in e) and Supplementary Video 8 suggest the central portions of ACs are constrained to regions that are small compared to AC diameters. Indicated times are final time points of each 55 s acquisition, with the first time in the image series set to 0 s. Scale bar, 0.05 µm.

Comment in

Similar articles

Cited by

References

    1. Lippincott-Schwartz J, Patterson GH. Development and use of fluorescent protein markers in living cells. Science. 2003;300:87–91. - PubMed
    1. Stephens DJ, Allan VJ. Light microscopy techniques for live cell imaging. Science. 2003;300:82–86. - PubMed
    1. de Lange F, et al. Cell biology beyond the diffraction limit: near-field scanning optical microscopy. J. Cell Sci. 2001;114:4153–4160. - PubMed
    1. Willig KI, et al. Nanoscale resolution in GFP-based microscopy. Nat. Methods. 2006;3:721–723. - PubMed
    1. Betzig E, et al. Imaging intracellular fluorescent proteins at nanometer resolution. Science. 2006;313:1642–1645. - PubMed

Publication types