

Expression of microRNAs and their precursors in synaptic fractions of adult mouse forebrain
- PMID: 18410515
- PMCID: PMC3711666
- DOI: 10.1111/j.1471-4159.2008.05413.x
Expression of microRNAs and their precursors in synaptic fractions of adult mouse forebrain
Abstract
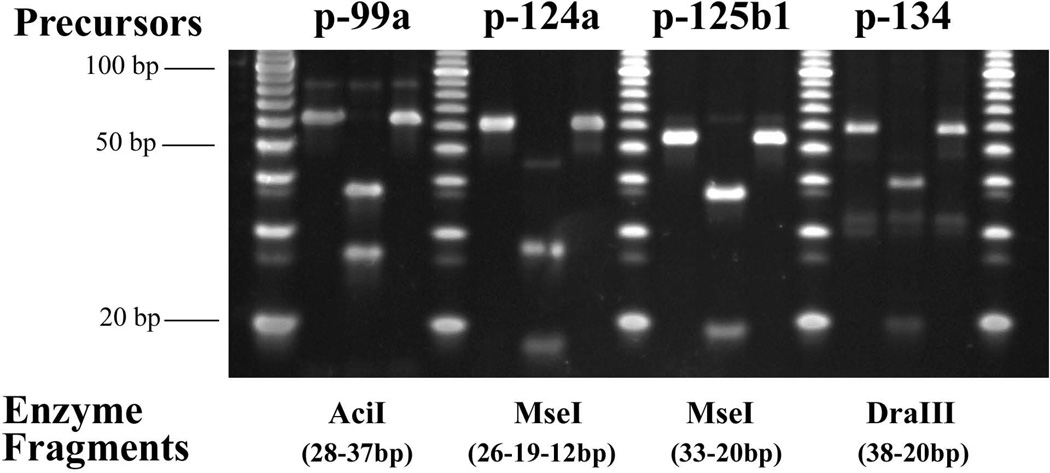
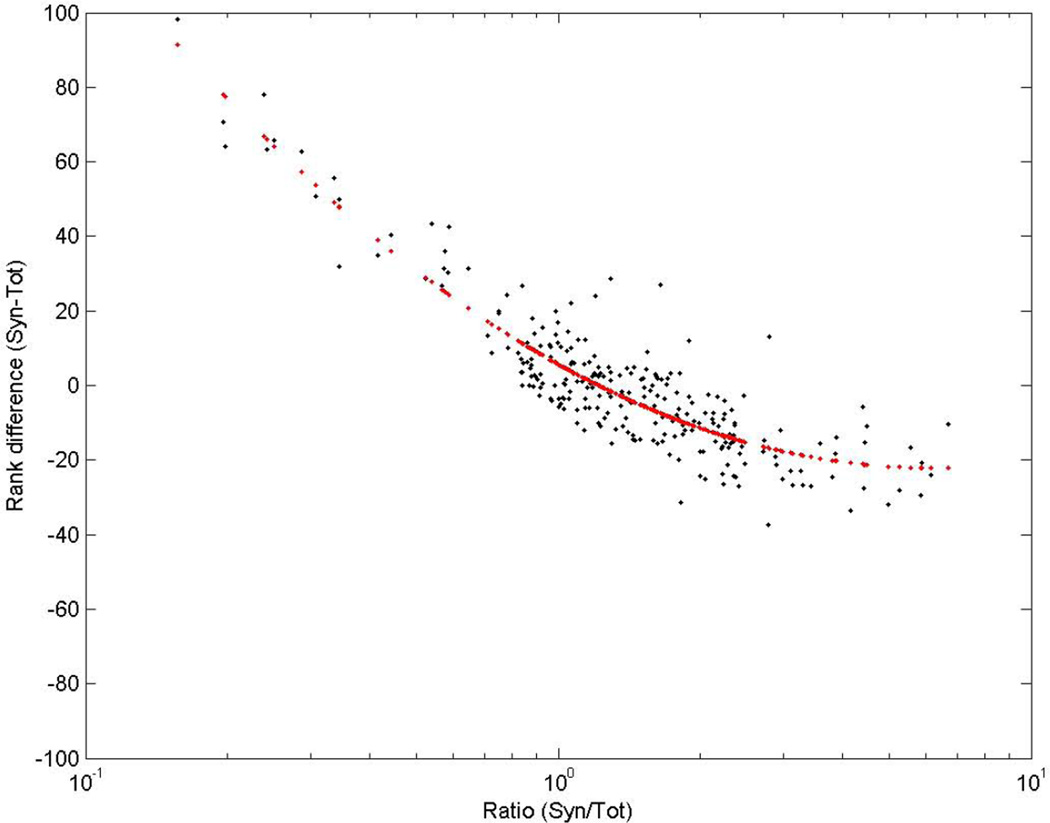
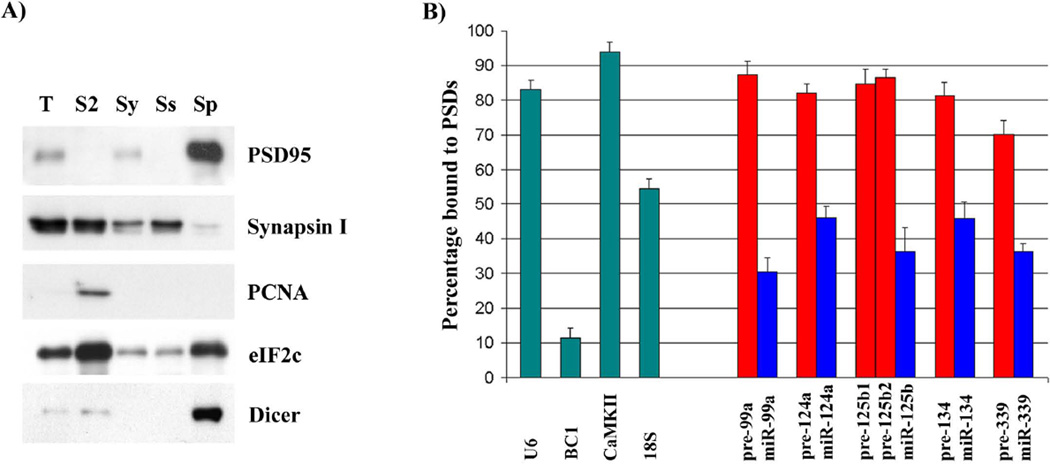
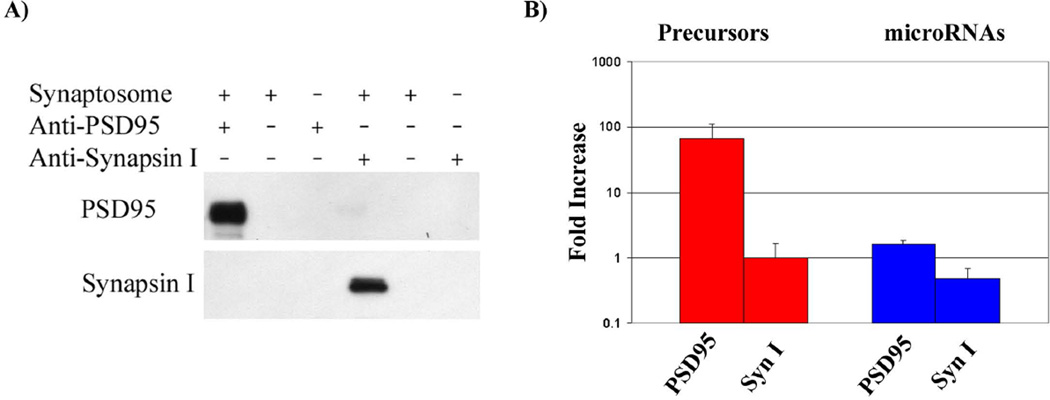
We have characterized the expression of microRNAs and selected microRNA precursors within several synaptic fractions of adult mouse forebrain, including synaptoneurosomes, synaptosomes and isolated post-synaptic densities (PSDs), using methods of microRNA microarray, real time qRT-PCR, Northern blotting and immunopurification using anti-PSD95 antibody. The majority of brain microRNAs (especially microRNAs known to be expressed in pyramidal neurons) are detectably expressed in synaptic fractions, and a subset of microRNAs is significantly enriched in synaptic fractions relative to total forebrain homogenate. MicroRNA precursors are also detectable in synaptic fractions at levels that are comparable to whole tissue. Whereas mature microRNAs are predominantly associated with soluble components of the synaptic fractions, microRNA precursors are predominantly associated with PSDs. For seven microRNAs examined, there was a significant correlation between the relative synaptic enrichment of the precursor and the relative synaptic enrichment of the corresponding mature microRNA. These findings support the proposal that microRNAs are formed, at least in part, via processing of microRNA precursors locally within dendritic spines. Dicer is expressed in PSDs but is enzymatically inactive until conditions that activate calpain cause its liberation; thus, we propose that synaptic stimulation may lead to local processing of microRNA precursors in proximity to the synapse.
Figures


Similar articles
-
Primary microRNA precursor transcripts are localized at post-synaptic densities in adult mouse forebrain.J Neurochem. 2012 Nov;123(4):459-66. doi: 10.1111/j.1471-4159.2012.07921.x. Epub 2012 Sep 28. J Neurochem. 2012. PMID: 22897173
-
Pre-synaptic and post-synaptic localization of EphA4 and EphB2 in adult mouse forebrain.J Neurochem. 2008 Jul;106(2):682-95. doi: 10.1111/j.1471-4159.2008.05416.x. Epub 2008 Apr 12. J Neurochem. 2008. PMID: 18410519
-
Synaptic enrichment of microRNAs in adult mouse forebrain is related to structural features of their precursors.Biol Direct. 2008 Oct 29;3:44. doi: 10.1186/1745-6150-3-44. Biol Direct. 2008. PMID: 18957138 Free PMC article.
-
microRNA regulation of synaptic plasticity.Neuromolecular Med. 2009;11(3):133-40. doi: 10.1007/s12017-009-8065-2. Epub 2009 May 21. Neuromolecular Med. 2009. PMID: 19458942 Free PMC article. Review.
-
Regulation of mammalian microRNA processing and function by cellular signaling and subcellular localization.Biochim Biophys Acta. 2008 Nov;1779(11):678-81. doi: 10.1016/j.bbagrm.2008.03.009. Epub 2008 Apr 8. Biochim Biophys Acta. 2008. PMID: 18433727 Free PMC article. Review.
Cited by
-
An emerging role for microRNAs in sexually dimorphic neurobiological systems.Pflugers Arch. 2013 May;465(5):655-67. doi: 10.1007/s00424-013-1227-y. Epub 2013 Feb 9. Pflugers Arch. 2013. PMID: 23397171 Free PMC article. Review.
-
Identification of precursor microRNAs within distal axons of sensory neuron.J Neurochem. 2015 Jul;134(2):193-9. doi: 10.1111/jnc.13140. Epub 2015 May 23. J Neurochem. 2015. PMID: 25919946 Free PMC article.
-
microRNAs Sculpt Neuronal Communication in a Tight Balance That Is Lost in Neurological Disease.Front Mol Neurosci. 2018 Dec 12;11:455. doi: 10.3389/fnmol.2018.00455. eCollection 2018. Front Mol Neurosci. 2018. PMID: 30618607 Free PMC article. Review.
-
Synaptosome microRNAs regulate synapse functions in Alzheimer's disease.NPJ Genom Med. 2022 Aug 8;7(1):47. doi: 10.1038/s41525-022-00319-8. NPJ Genom Med. 2022. PMID: 35941185 Free PMC article.
-
Enoxacin Elevates MicroRNA Levels in Rat Frontal Cortex and Prevents Learned Helplessness.Front Psychiatry. 2014 Feb 10;5:6. doi: 10.3389/fpsyt.2014.00006. eCollection 2014. Front Psychiatry. 2014. PMID: 24575053 Free PMC article.
References
-
- Asaki C, Usuda N, Nakazawa A, Kametani K, Suzuki T. Localization of translational components at the ultramicroscopic level at postsynaptic sites of the rat brain. Brain Res. 2003;972:168–176. - PubMed
-
- Ashraf SI, McLoon AL, Sclarsic SM, Kunes S. Synaptic protein synthesis associated with memory is regulated by the RISC pathway in Drosophila. Cell. 2006;124:191–205. - PubMed
-
- Barco A, Lopez de Armentia M, Alarcon JM. Synapse-specific stabilization of plasticity processes: The synaptic tagging and capture hypothesis revisited 10 years later. Neurosci Biobehav Rev. 2008;32:831–851. - PubMed
-
- Bourne JN, Sorra KE, Hurlburt J, Harris KM. Polyribosomes are increased in spines of CA1 dendrites 2 h after the induction of LTP in mature rat hippocampal slices. Hippocampus. 2007;17:1–4. - PubMed
Publication types
MeSH terms
Substances
Grants and funding
LinkOut - more resources
Full Text Sources
Other Literature Sources
Molecular Biology Databases
