

HPLC/UV quantitation of retinal, retinol, and retinyl esters in serum and tissues
- PMID: 18410739
- PMCID: PMC2483537
- DOI: 10.1016/j.ab.2008.03.038
HPLC/UV quantitation of retinal, retinol, and retinyl esters in serum and tissues
Abstract
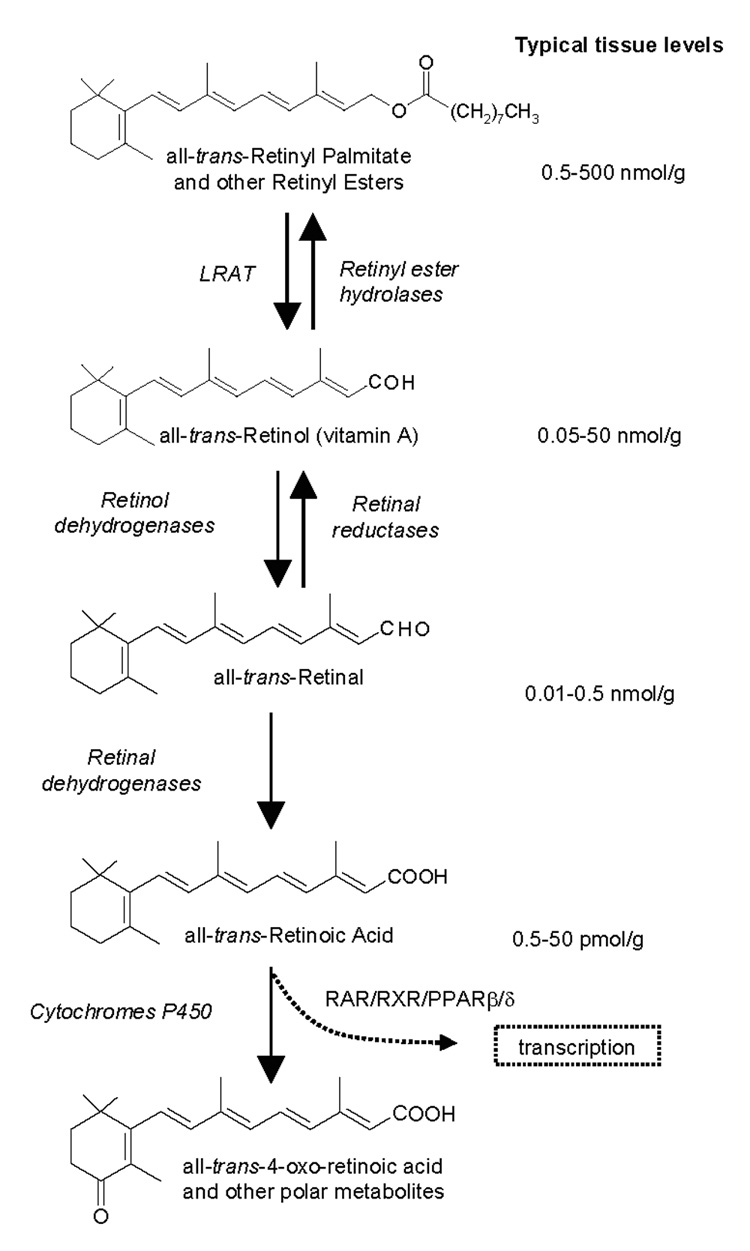
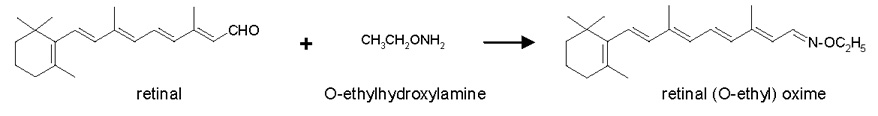
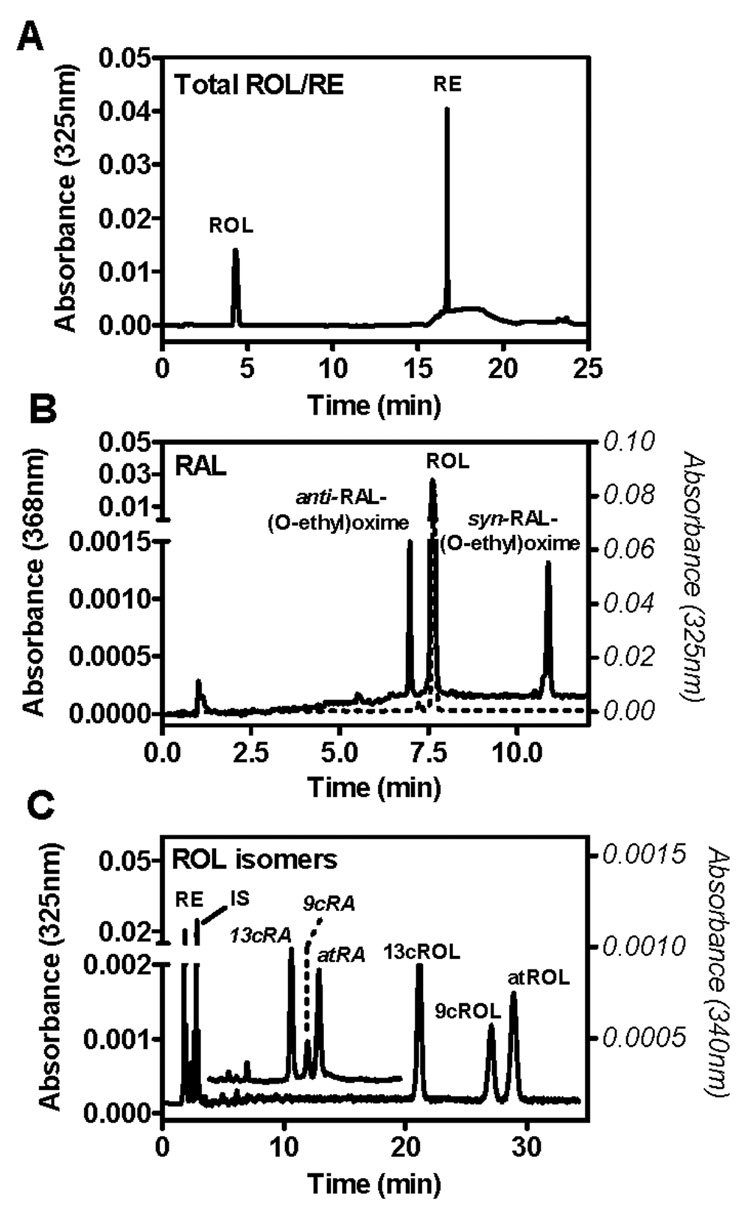
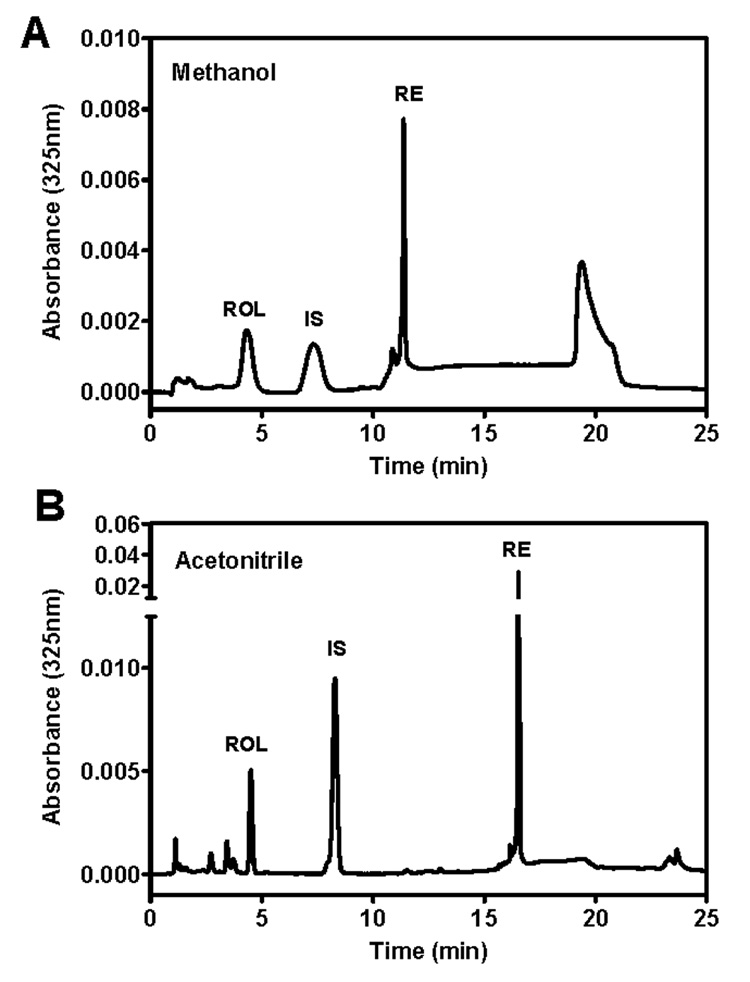
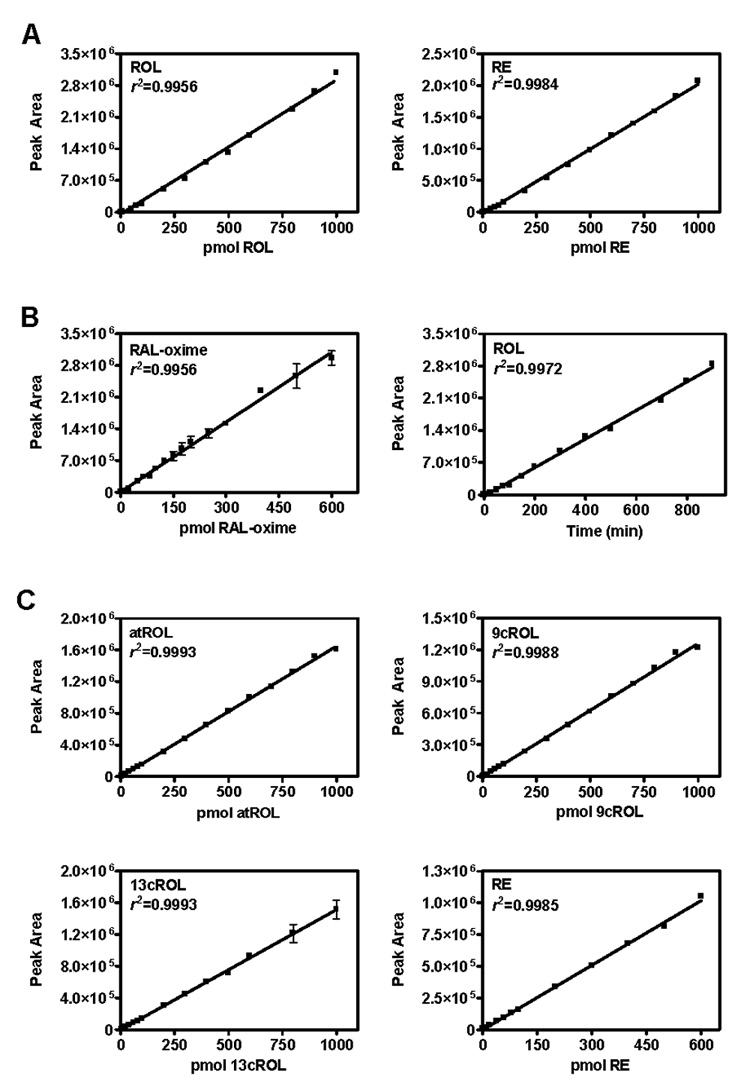
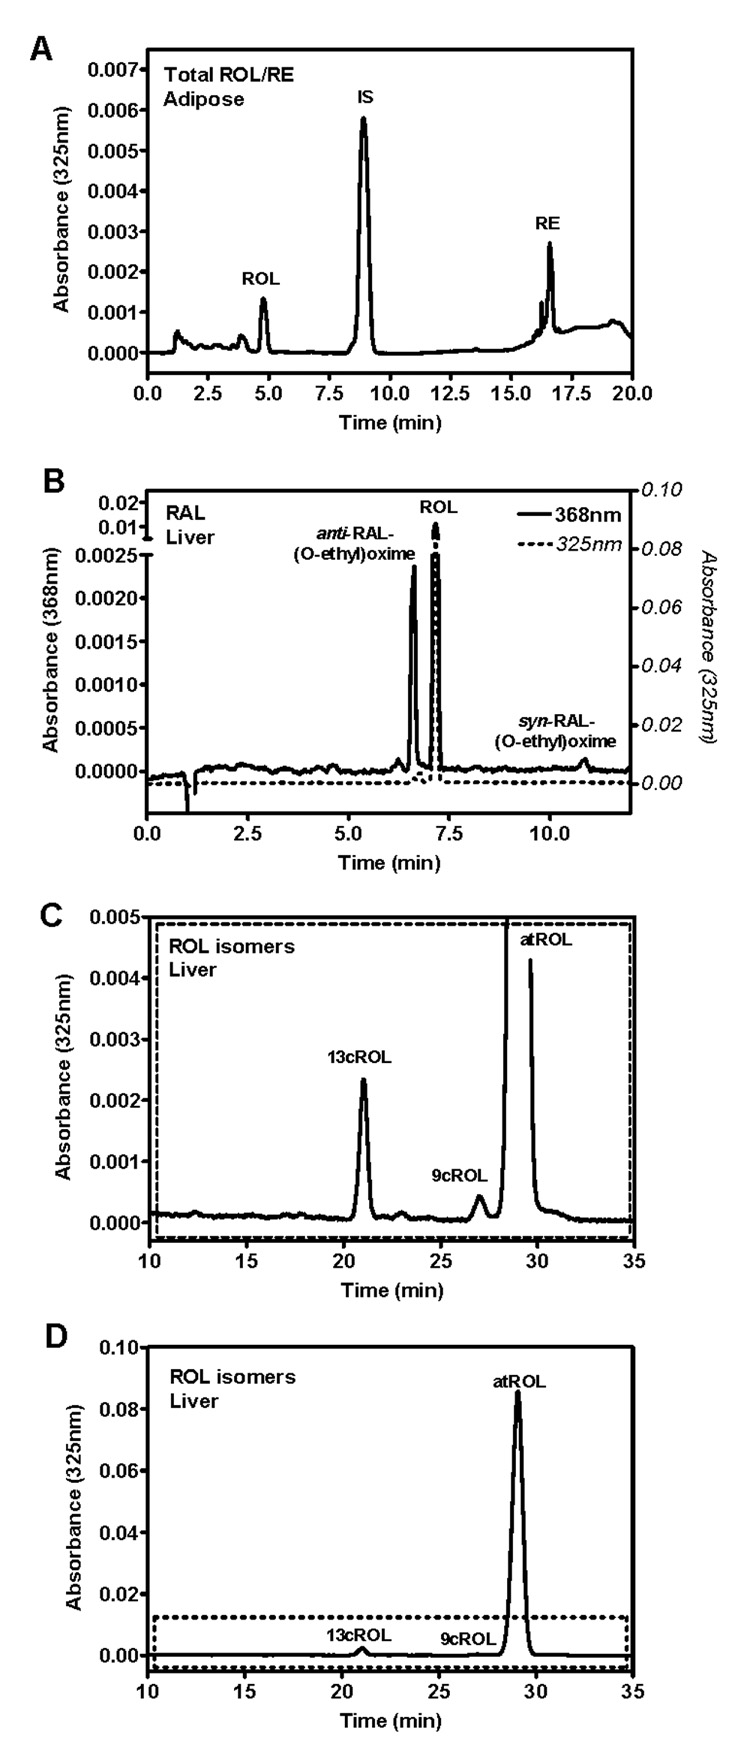
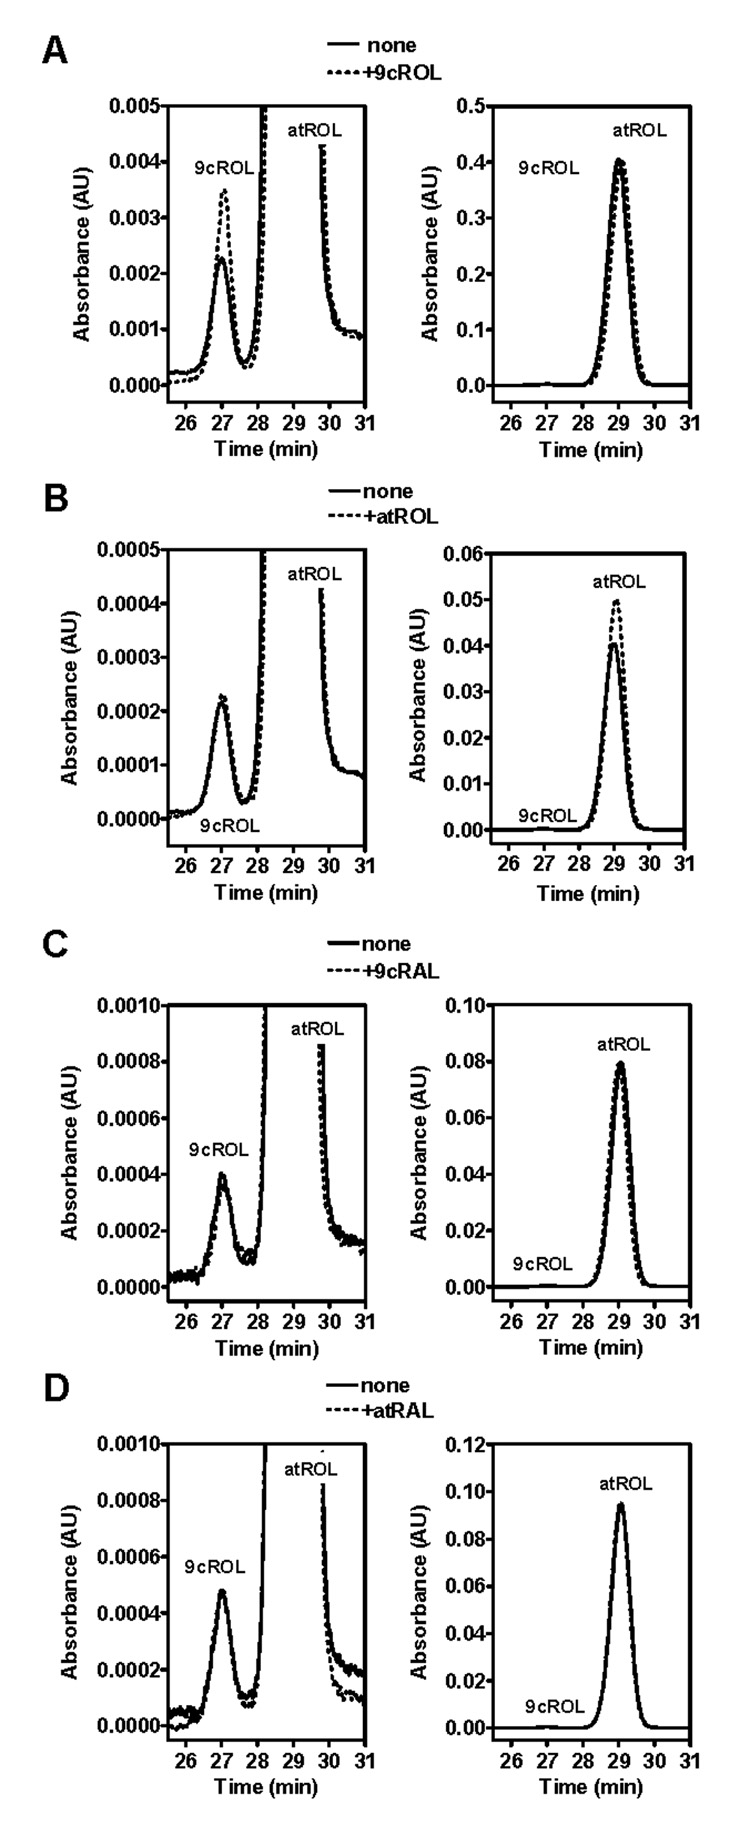
We report robust HPLC/UV methods for quantifying retinyl esters (RE), retinol (ROL), and retinal (RAL) applicable to diverse biological samples with lower limits of detection of 0.7, 0.2, and 0.2 pmol, respectively, and linear ranges greater than 3 orders of magnitude. These assays function well with small, complex biological samples (10-20mg tissue). Coefficients of variation range from 5.9 to 10.0% (intraday) and from 5.9 to 11.0% (interday). Quantification of endogenous RE, ROL, and RAL in mouse serum and tissues (liver, kidney, adipose, muscle, spleen, testis, skin, brain, and brain regions) reveals utility. Ability to discriminate spatial concentrations of ROL and RE is illustrated with C57BL/6 mouse brain loci (hippocampus, cortex, olfactory bulb, thalamus, cerebellum, and striatum). We also developed a method to distinguish isomeric forms of ROL to investigate precursors of retinoic acid. The ROL isomer assay has limits of detection between 3.5 and 4.5 pmol and has a linear range and coefficient of variation similar to those of the ROL/RE and RAL assays. The assays described here provide for sensitive and rigorous quantification of endogenous RE, ROL, and RAL to elucidate retinoid homeostasis in disease states such as Alzheimer's disease, type 2 diabetes, obesity, and cancer.
Figures
References
-
- Wolf G. Multiple functions of vitamin A. Physiol. Rev. 1984;64:873–937. - PubMed
-
- Sporn MB, Roberts AB, Goodman DS, editors. The Retinoids: Biology, Chemistry, and Medicine. 2nd Ed. NY: Raven Press; 1994.
-
- Wolf G. Retinoic acid homeostasis: retinoic acid regulates liver retinol esterification as well as its own catabolic oxidation in liver. Nutr. Rev. 2001;59:391–394. - PubMed
-
- Harrison EH. Mechanisms of digestion and absorption of dietary vitamin A. Annu. Rev. Nutr. 2005;25:87–103. - PubMed
-
- Blomhoff R, Blomhoff HK. Overview of retinoid metabolism and function. J. Neurobiol. 2006;66:606–630. - PubMed
Publication types
MeSH terms
Substances
Grants and funding
LinkOut - more resources
Full Text Sources
Other Literature Sources
Medical
