. 2008 May 30;283(22):14910-4.
doi: 10.1074/jbc.C800074200. Epub 2008 Apr 14.

The miR-200 family inhibits epithelial-mesenchymal transition and cancer cell migration by direct targeting of E-cadherin transcriptional repressors ZEB1 and ZEB2

Affiliations

The miR-200 family inhibits epithelial-mesenchymal transition and cancer cell migration by direct targeting of E-cadherin transcriptional repressors ZEB1 and ZEB2

Manav Korpal et al. J Biol Chem. .

Abstract

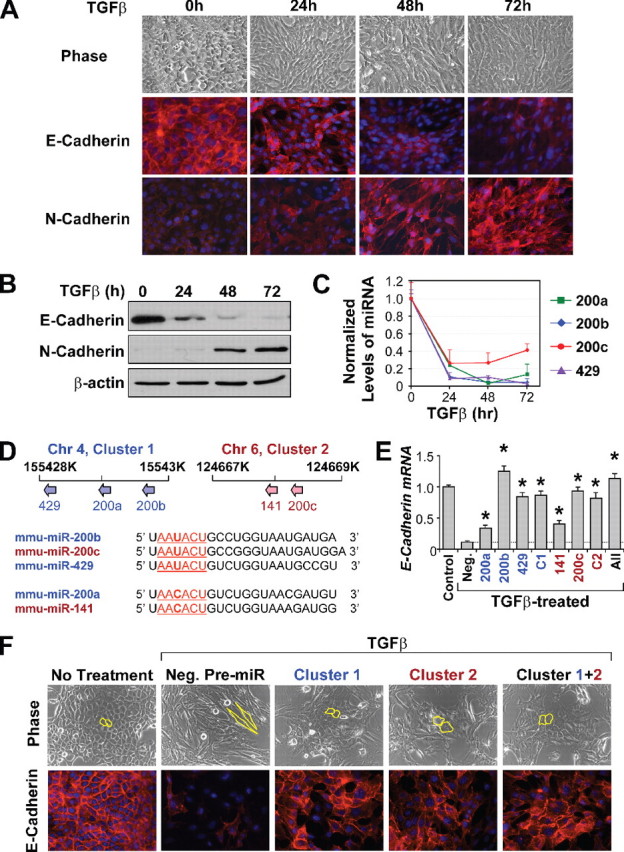
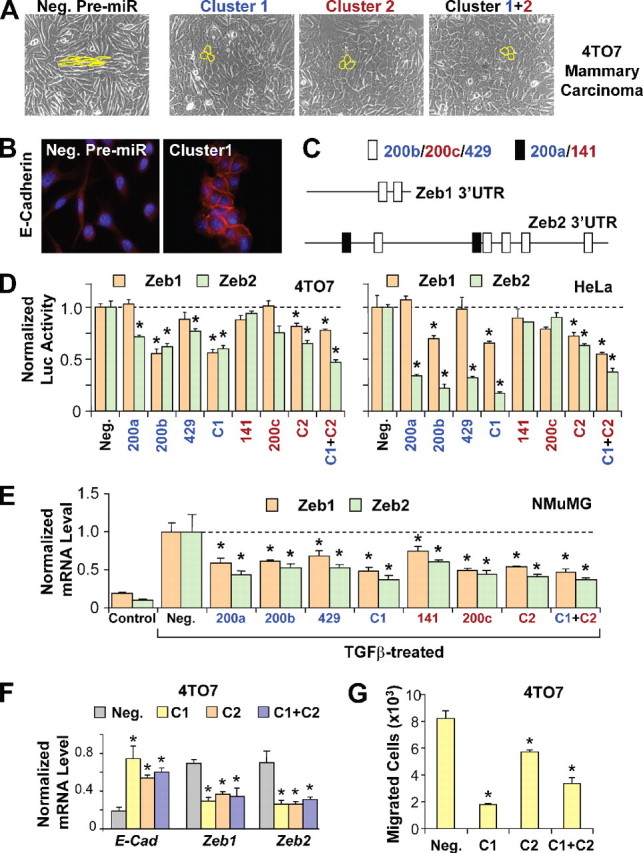
MicroRNAs are small non-coding RNA molecules that can regulate gene expression by interacting with multiple mRNAs and inducing either translation suppression or degradation of mRNA. Recently, several miRNAs were identified as either promoters or suppressors of metastasis. However, it is unclear in which step(s) of the multistep metastatic cascade these miRNAs play a defined functional role. To study the functional importance of miRNAs in epithelial-mesenchymal transition (EMT), a process thought to initiate metastasis by enhancing the motility of tumor cells, we used a well established in vitro EMT assay: transforming growth factor-beta-induced EMT in NMuMG murine mammary epithelial cells. We found that members of the miR-200 family, organized as two clusters in the genome, were repressed during EMT. Overexpression of each miRNA individually or as clusters in NMuMG cells hindered EMT by enhancing E-cadherin expression through direct targeting of ZEB1 and ZEB2, which encode transcriptional repressors of E-cadherin. In the 4TO7 mouse carcinoma cell line, which expresses low levels of endogenous E-cadherin and displays a mesenchymal phenotype, ectopic expression of the miR-200 family miRNAs significantly increased E-cadherin expression and altered cell morphology to an epithelial phenotype. Furthermore, ectopic expression of each miR-200 miRNA cluster significantly reduced the in vitro motility of 4TO7 cells in migration assays. These results suggested that loss of expression of the miR-200 family members may play a critical role in the repression of E-cadherin by ZEB1 and ZEB2 during EMT, thereby enhancing migration and invasion during cancer progression.


Figures

FIGURE 1.
FIGURE 1.
Overexpression of miR-200 family hinders EMT and up-regulates E-cadherin expression. A, phase contrast images and immunofluorescence staining of E-cadherin and N-cadherin in NMuMG cells undergoing EMT. B, Western blot analysis confirms down-regulation of E-cadherin and up-regulation of N-cadherin during EMT. C, changes in the miR-200 family levels in TGFβ-treated NMuMG cells, as measured by TaqMan qRT-PCR and normalized to U6 expression. The data are means from a representative time course experiment measured in triplicate and are presented as mean ± S.E. D, upper panel, schematic of chromosomal locations of the miR-200 family members in the mouse genome. Lower panel, sequence alignment of the miR-200 family members. Nucleotides 2–7, representing their seed sequences, are underlined. miR-200 members embedded within cluster 1 are in blue, whereas those embedded in cluster 2 are in red. Chr 4, chromosome 4. E, changes in expression of E-cadherin in NMuMG cells treated with TGFβ and transfected with miR-200 members individually, as clusters (C1 or C2), or altogether (All), as measured by real-time PCR. Expression levels are compared with cells untreated with TGFβ (control) or TGFβ-treated cells transfected with a negative control pre-miR (Neg.). * represents p < 0.05 as compared with control pre-miR. F, phase contrast microscopy and E-cadherin staining of NMuMG cells untreated or treated with TGFβ after being transfected with negative control pre-miR, cluster 1, cluster 2, or both clusters simultaneously (Cluster 1+2). Cell morphology is outlined in yellow.
FIGURE 2.
FIGURE 2.
miR-200 family targets transcriptional repressors ZEB1 and ZEB2 to enhance E-cadherin expression and inhibit migration. A, phase contrast microscopy of 4TO7 cells transfected with negative control pre-miR (Neg.), cluster 1, cluster 2, or both clusters simultaneously (Cluster 1+2). Cell morphology is outlined in yellow. B, E-cadherin staining of 4TO7 cells transfected with negative control pre-miR or cluster 1. C, schematic of putative miR-200 target sites in the mouse ZEB1 and ZEB2 3′-UTRs. White boxes represent target sites for miR-200b/200c/429, whereas black boxes represent target sites for miR-200a/141. D, normalized activity of luciferase reporter with the ZEB1 (brown bars) or ZEB2 (green bars)3′-UTR in 4TO7 (left panel) or HeLa cells (right panel) in the presence of co-transfected negative control pre-miR or miR-200 members individually, as clusters (C1 or C2) or both clusters (C1 + C2). Luciferase activity was measured after 24 h. The data are mean ± S.E. of triplicates and are shown as the ratio of firefly to Renilla luciferase activity. E, expression levels of ZEB1 and ZEB2 in NMuMG cells untreated (Control) or treated with TGFβ, transfected with negative control pre-miR or miR-200 family members individually, as clusters (C1 or C2), or both clusters (C1 + C2). F, changes in expression of E-cadherin (E-Cad), ZEB1, and ZEB2 (normalized to GAPDH without further normalization to the negative control) in 4TO7 cells transfected with negative control pre-miR or with cluster 1, cluster 2, or both clusters. G, migration of 4TO7 cells transfected with negative control pre-miR, cluster 1, cluster 2, or both clusters, toward serum containing media. The data are the average number of cells that migrated in a representative experiment measured in triplicate and are presented as means + S.E. * represents p < 0.05.

References

    1. Lee, Y., Ahn, C., Han, J., Choi, H., Kim, J., Yim, J., Lee, J., Provost, P., Radmark, O., Kim, S., and Kim, V. N. (2003) Nature 425 415–419 - PubMed
    1. Yi, R., Qin, Y., Macara, I. G., and Cullen, B. R. (2003) Genes Dev. 17 3011–3016 - PMC - PubMed
    1. Hutvagner, G., McLachlan, J., Pasquinelli, A. E., Balint, E., Tuschl, T., and Zamore, P. D. (2001) Science 293 834–838 - PubMed
    1. Wienholds, E., Kloosterman, W. P., Miska, E., Alvarez-Saavedra, E., Berezikov, E., de Bruijn, E., Horvitz, H. R., Kauppinen, S., and Plasterk, R. H. (2005) Science 309 310–311 - PubMed
    1. Yi, R., O'Carroll, D., Pasolli, H. A., Zhang, Z., Dietrich, F. S., Tarakhovsky, A., and Fuchs, E. (2006) Nat. Genet. 38 356–362 - PubMed

Publication types

MeSH terms