. 2008 Apr 21;181(2):203-11.
doi: 10.1083/jcb.200711149. Epub 2008 Apr 14.

Spinophilin participates in information transfer at immunological synapses

Affiliations

Spinophilin participates in information transfer at immunological synapses

Ona Bloom et al. J Cell Biol. .

Abstract

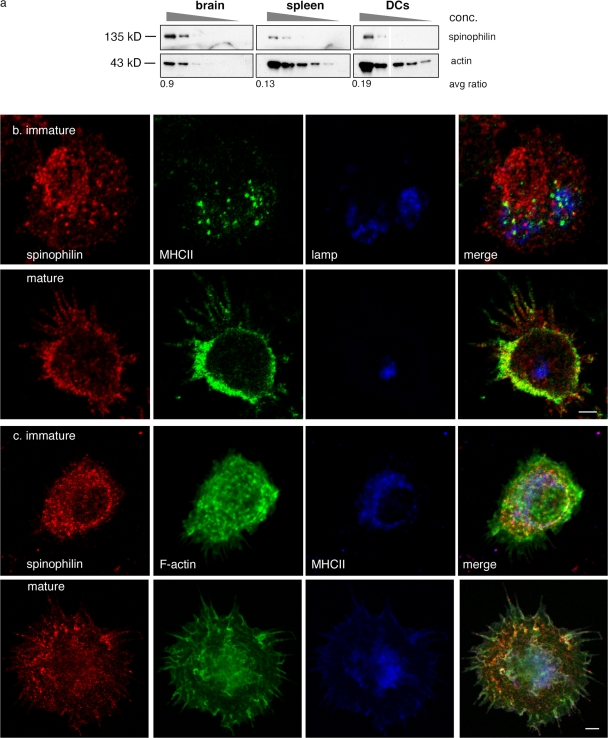
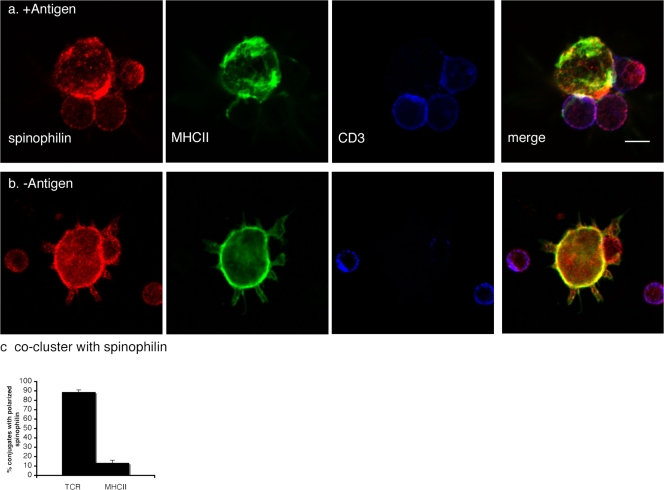
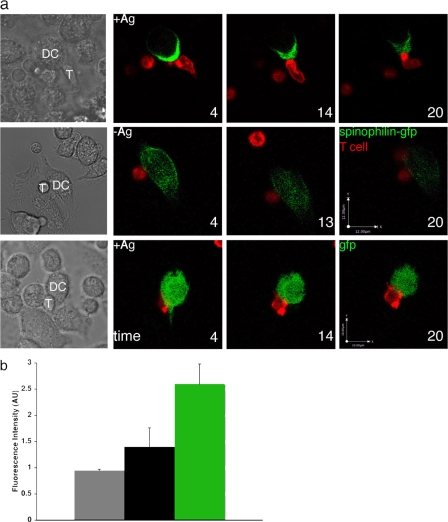
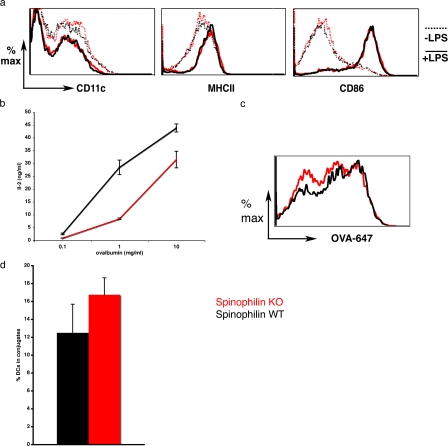
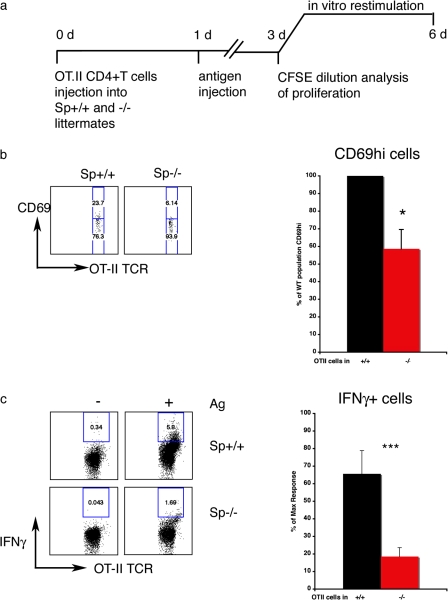
The adaptive immune response is initiated by the presentation of peptides bound to major histocompatibility complex molecules on dendritic cells (DCs) to antigen-specific T lymphocytes at a junction termed the immunological synapse. Although much attention has been paid to cytoplasmic events on the T cell side of the synapse, little is known concerning events on the DC side. We have sought signal transduction components of the neuronal synapse that were also expressed by DCs. One such protein is spinophilin, a scaffolding protein of neuronal dendritic spines that regulates synaptic transmission. In inactive, immature DCs, spinophilin is located throughout the cytoplasm but redistributes to the plasma membrane upon stimulus-induced maturation. In DCs interacting with T cells, spinophilin is polarized dynamically to contact sites in an antigen-dependent manner. It is also required for optimal T cell activation because DCs derived from mice lacking spinophilin exhibit defects in antigen presentation both in vitro and in vivo. Thus, spinophilin may play analogous roles in information transfer at both neuronal and immunological synapses.


Figures

Figure 1.
Figure 1.
Spinophilin is expressed in the immune cells and its localization in DCs is dynamic. (a) Detection of spinophilin by Western blot in serial dilutions of cell lysates from brain, spleen, or DCs. Numbers below indicate the ratio of adjusted mean density of spinophilin to actin on the Western blot. (b) Localization of spinophilin was detected by immunofluorescence in immature (top) and mature BMDCs (bottom) as indicated. DCs were stained with anti-spinophilin (RU466; Allen et al., 1997) and anti-MHCII (14.4.4 anti–IE-k FITC) antibodies and, to detect lysosomes, anti-Lamp (Lamp2) antibodies. (c) Localization of spinophilin, actin, and MHCII was detected by immunofluorescence in immature (top) and mature BMDCs (bottom) as indicated. DCs were stained with anti-spinophilin (RU466; Allen et al., 1997), TRITC-phalloidin, and anti-MHCII (14.4.4 anti–IE-k FITC) antibodies. Images in section c were pseudo-colored for illustrative purposes. Bars, 5 μM.
Figure 2.
Figure 2.
Spinophilin is recruited to the IS. (a and b) DCs (day six) were cocultured in the presence (+Antigen) or absence (−Antigen) of agonist peptide (MCC; a and b, respectively) and splenic CD4+ T cells. Confocal sections along the z axis of conjugated cells are shown in a and b. (a) In the presence of an antigen, topographical distribution of spinophilin (red), MHCII (green), and CD3, a component of the TCR (Cy5), reveals the polarization of spinophilin on the DC toward activated T cells. (b) In the absence of antigen, spinophilin remains localized close to the plasma membrane, as seen in mature DCs cultured in the absence of T cells (Fig. 1). Bar, 5 μm. (c) Correlation of spinophilin polarization in DCs with TCR clustering within T cells. Within DCs, the polarization of spinophilin toward contacting T cells correlated with TCR clustering to the contact site but not with MHCII. Error bars indicate the SEM.
Figure 3.
Figure 3.
Real-time imaging of spinophilin polarizing at the IS. (a) DCs expressing spinophilin-GFP that were cultured in the presence (+Ag; top, n = 6 conjugates) or absence (−Ag; middle, n = 3 conjugates) of agonist peptide together with antigen-specific CD4+ T cells that had been labeled red by the lipophilic PKH-26 dye (Sigma-Aldrich). In the presence of the antigen, spinophilin was polarized minutes after contact and remained polarized throughout the duration of the contact (30–60 min; a, top; and b). In the absence of antigen, spinophilin was distributed throughout the cytoplasm (a, middle; and b). As a control, the distribution of GFP alone in DCs contacting T cells (n = 3 conjugates) was imaged in the presence of the antigen and localized evenly throughout the cytoplasm (a, bottom). Time is indicated in minutes after imaging began and is rounded to the nearest minute. The bar in section a (middle) applies to the spinophilin-GFP +/− antigen. T, T cell. (b) The distribution of fluorescence signal for GFP alone with an antigen (gray) and spinophilin-GFP both with (green) and without an antigen (black) in live cells was analyzed at 0, 4, 14, and 20 min after imaging began (n = 9, 12, and 22 observations from 3, 3, and 6 conjugates, respectively, for GFP alone, spinophilin-GFP –Ag, and spinophilin-GFP +Ag). Spinophilin-GFP was most polarized toward the T cell in the presence of the antigen (P < 0.05 with respect to spinophilin-gfp –Ag; P < 0.002 with respect to GFP alone +Ag by Student's t test).
Figure 4.
Figure 4.
Spinophilin plays a functional role in antigen presentation in vitro. (a) DCs isolated from spinophilin KO (dotted lines) and WT mice (solid lines) were stimulated in vitro and the expression of cell surface markers was analyzed by flow cytometry. WT (black) and KO (red) solid lines indicate unstimulated cells, whereas dotted lines are cells stimulated (matured) overnight at day five in culture by 30 ng/ml LPS. Expression of cell surface markers was comparable between the two cell types. Data are representative of three independent experiments. (b, left) DCs were isolated from spinophilin WT (black) or KO (red) mice and cocultured with OT-II CD4+ T cells in the presence of an antigen (ovalbumin). After 18 h, supernatants were isolated and assayed for IL-2 by ELISA. Values shown are the mean of triplicate measurements ± SD. (c) DCs were isolated from spinophilin WT (black) and KO (red) mice and cultured for 5 d. Ovalbumin-647 was incubated with DCs for 10 min at 37°C and chased for 1 h. A representative of three experiments is shown (n = 8 animals total from three independent experiments; cells are gated on CD11c+). Uptake of FITC-RNAase and FITC-dextran yielded similar results (not depicted). (d) DCs from −/− or +/+ mice were cultured for 5–6 d, matured with 30 ng/ml LPS, and pulsed with an antigen (10 μg/ml ovalbumin aa 323–339 peptide). DCs were then cultured with OT-II CD4+ T cells for 20–60 min, fixed, and labeled for immunofluorescence microscopy. The number of fixed conjugates was counted for both KO and WT cells and found to be comparable (P = 0.15; n = 4 animals per group; n = 562 and 625 cells, respectively). Error bars indicate the SEM.
Figure 5.
Figure 5.
Spinophilin plays a functional role in antigen presentation in vivo. (a) Protocol: CD4+ T cells were isolated form TCR-transgenic mice (OT-II) and labeled with CFSE. 106 labeled cells were injected i.v. into WT and KO littermates. 1 d later, animals were injected i.v. with 10 μg ovalbumin + 100 ng LPS or LPS alone. On day three, spleen cells from WT and KO mice were isolated and analyzed for proliferation as measured by CFSE dilution or restimulated with ovalbumin (0, 10, and 20 μg/ml) for an additional 3 d. Intracellular cytokine staining was then performed. (b) The CD69hi population of adoptively transferred T cells was smaller in spinophilin KO (red) than in spinophilin WT (black) mice. Representative flow cytometry plots (left) and the data pooled from four independent experiments (right) is shown (n = 14 WT and 15 KO mice total; *, P < 0.05 by Student's t test). (c) The relative abundance of IFNγ-producing effector T cells was significantly greater in WT than in KO, as measured by flow cytometry of intracellular cytokine staining. (left) Representative flow cytometry plots. (right) Data pooled from three independent experiments (n = 8 animals total for WT and KO; ***, P < 0.001 by Student's t test).

Similar articles

Cited by

References

    1. Allen, P.B. 2004. Functional plasticity in the organization of signaling complexes in the striatum. Parkinsonism Relat. Disord. 10:287–292. - PubMed
    1. Allen, P.B., C.C. Ouimet, and P. Greengard. 1997. Spinophilin, a novel protein phosphatase 1 binding protein localized to dendritic spines. Proc. Natl. Acad. Sci. USA. 94:9956–9961. - PMC - PubMed
    1. Allen, P.B., V. Zachariou, P. Svenningsson, A.C. Lepore, D. Centonze, C. Costa, S. Rossi, G. Bender, G. Chen, J. Feng, et al. 2006. Distinct roles for spinophilin and neurabin in dopamine-mediated plasticity. Neuroscience. 140:897–911. - PubMed
    1. Benvenuti, F., S. Hugues, M. Walmsley, S. Ruf, L. Fetler, M. Popoff, V.L. Tybulewicz, and S. Amigorena. 2004. Requirement of Rac1 and Rac2 expression by mature dendritic cells for T cell priming. Science. 305:1150–1153. - PubMed
    1. Bielas, S.L., F.F. Serneo, M. Chechlacz, T.J. Deerinck, G.A. Perkins, P.B. Allen, M.H. Ellisman, and J.G. Gleeson. 2007. Spinophilin facilitates dephosphorylation of doublecortin by PP1 to mediate microtubule bundling at the axonal wrist. Cell. 129:579–591. - PMC - PubMed

Publication types

MeSH terms