. 2008 May 12;205(5):1049-62.
doi: 10.1084/jem.20071364. Epub 2008 Apr 14.

TL1A-DR3 interaction regulates Th17 cell function and Th17-mediated autoimmune disease

Affiliations

TL1A-DR3 interaction regulates Th17 cell function and Th17-mediated autoimmune disease

Bhanu P Pappu et al. J Exp Med. .

Abstract

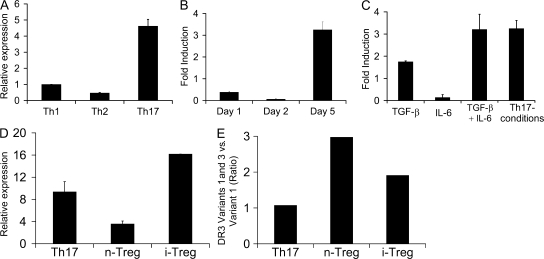
T helper type 17 (Th17) cells play an important pathogenic function in autoimmune diseases; their regulation, however, is not well understood. We show that the expression of a tumor necrosis factor receptor family member, death receptor 3 (DR3; also known as TNFRSF25), is selectively elevated in Th17 cells, and that TL1A, its cognate ligand, can promote the proliferation of effector Th17 cells. To further investigate the role of the TL1A-DR3 pathway in Th17 regulation, we generated a TL1A-deficient mouse and found that TL1A(-/-) dendritic cells exhibited a reduced capacity in supporting Th17 differentiation and proliferation. Consistent with these data, TL1A(-/-) animals displayed decreased clinical severity in experimental autoimmune encephalomyelitis (EAE). Finally, we demonstrated that during EAE disease progression, TL1A was required for the optimal differentiation as well as effector function of Th17 cells. These observations thus establish an important role of the TL1A-DR3 pathway in promoting Th17 cell function and Th17-mediated autoimmune disease.


Figures

Figure 1.
Figure 1.
DR3 expression is greatly enhanced in Th17 cells. Naive OT-II cells were differentiated and DR3 expression was analyzed by real-time PCR analysis. DR3 expression was determined relative to naive CD4+ T cell expression levels and normalized to GAPDH levels in all samples. (A) Comparison of DR3 expression on CD4+ cells differentiated under Th1, Th2, and Th17 conditions. (B) Time-course analysis of DR3 expression in CD4+ T cells differentiating under Th17 conditions. (C) Analysis of DR3 expression in cells differentiated under different combinations of cytokines. Primers used in A–C detect all DR3 isoforms. (D) Analysis of the full-length transmembrane-containing DR3 isoform (variant 1) in Th17 and T reg cells. (E) The ratio of total transmembrane DR3 (variants 1 and 3 combined) and full-length transmembrane DR3 (variant 1) was measured in Th17 and T reg cells. Error bars represent SD.
Figure 2.
Figure 2.
TL1A enhances the differentiation. (A) The addition of TL1A during naive T cell activation increases IL-2 production. Naive CD4+ T cells were stimulated with plate-bound anti-CD3/CD28 antibody under the indicated conditions. Culture supernatants were analyzed for IL-2 24 h later by ELISA. Data represent the mean of triplicate cultures, and error bars represent SD. Results are representative of three independent experiments with similar results. (B) TL1A regulates Th17 differentiation. Naive CD4+ T cells were stimulated by plate-bound anti-CD3/CD28, in the presence of control Ig or 1 μg/ml Fc-TL1A, and under Th17-differentiating conditions in the absence or presence of anti–IL-2 antibodies. The percentages of IL-17– and IFN-γ–producing cells were measured by intracellular cytokine staining. Data are a representative of three independent experiments with similar results.
Figure 3.
Figure 3.
TL1A enhances the proliferation of Th17 effector cells. (A and B) In vitro–differentiated Th1 and Th17 cells were restimulated on day 5 after activation with the indicated doses of anti-CD3 with or without 1 μg/ml of exogenous Fc-TL1A or control human Ig. Proliferation of Th1 cells (A) and Th17 cells (B) was determined by [3H]thymidine incorporation after 24 h of stimulation. In a parallel experiment, culture supernatant was analyzed for IFN-γ (A) and IL-17 (B) expression by ELISA. Data are representative of three independent experiments. (C) In vitro–differentiated Th1 and Th17 cells were restimulated with the indicated doses of exogenous Fc-TL1A. (left) The proliferation of Th1 and Th17 cells was determined by [3H]thymidine incorporation after 24 h of stimulation. (right) The proliferation of Th1 and Th17 cells in the absence or presence of 1 μg/ml Fc-TL1A was represented. Results are representative of three independent experiments. (D) TL1A specifically enhances Th17 cell proliferation. In vitro–differentiated Th1 and Th17 cells, and n–T reg and i–T reg cells were stimulated with control Ig or 1 μg/ml Fc-TL1A for 24 h. Proliferation was determined by [3H]thymidine incorporation during the last 8 h of stimulation. Proliferation in the presence of positive controls was as follows: anti-CD3 for Th1 and Th17 cells (14,000 and 30,000 CPM, respectively), and IL-2 for n–T reg and i–T reg cells (98,000 and 25,000 CPM, respectively). Data are representative of two independent experiments with similar results. Error bars represent SD.
Figure 4.
Figure 4.
TL1A targeting strategy and lymphocyte characterization from TL1A KO mice. (A) Restriction map of the mouse Tnfsf15 locus and the thymidine kinase (TK)– and neomycin (neo)-containing targeting construct derived from it. Restriction enzyme sites indicated are as follows: Ba, BamHI; Bg, BglII; E, EcoRI; and X, XbaI. Exons are represented as black boxes, and arrows indicate the direction of transcription. (B) RT-PCR analysis of TL1A mRNA in TL1A KO and WT kidneys. (C) Surface phenotype of naive WT (white bars) and TL1A KO (gray bars) lymph node cells. (left) Percentages of total lymphocytes positive for the indicated markers are plotted. (right) Percentages of CD4+ or CD8+ T cells positive for the indicated marker combinations are plotted. Data represent means of eight animals per group, and error bars are SEM.
Figure 5.
Figure 5.
Decreased differentiation of Th17 cells in response to stimulation by TL1A KO DCs. Naive OT-II CD4+ T cells were stimulated with either WT or TL1A KO BMDCs under polarized Th1- and Th17-differentiating conditions. Cells were harvested on day 6 and restimulated with PMA plus ionomycin, followed by intracellular cytokine staining for IFN-γ and IL-17. Dot plots represent the IFN-γ and IL-17 expression among CD4+ cells (percentages are shown). Data are representative of three independent experiments.
Figure 6.
Figure 6.
Reduced proliferation of Th17 cells upon restimulation by TL1A KO BMDCs. (A) In vitro–differentiated Th1 and Th17 cells were left unstimulated or restimulated on day 5 with WT or TL1A KO BMDCs for 24 h. Proliferation was measured by [3H]thymidine incorporation during the last 8 h of stimulation. (B) In vitro–differentiated Th17 cells were stimulated with WT or TL1A KO BMDCs with and without Fc-TL1A for 24 h. Proliferation was measured by [3H]thymidine incorporation during the last 8 h of stimulation. (C) In vitro–differentiated Th1 and Th17 cells were stimulated with WT or TL1A KO BMDCs pulsed with a titrating dose of OT-II peptide. The proliferation of Th1 and Th17 cells was determined at 24 h of stimulation by [3H]thymidine incorporation. The horizontal dashed line represents the baseline proliferation of Th1 or Th17 cells alone. Data are representative of three independent experiments. Error bars represent SD.
Figure 7.
Figure 7.
TL1A deficiency protects mice from EAE. (A) EAE clinical course in TL1A KO animals. EAE disease course in TL1A KO and WT mice. Mice were immunized with MOG35-55 and pertussis toxin, as described in Materials and methods. Values represent the mean clinical score for each group. The disease course is representative of four independent experiments (n = 7–10 animals per group). (B) Histological analysis. Spinal cord analysis at day 27 after immunization for TL1A KO, WT, and unimmunized WT (WT-untr) animals. Representative images are shown. Spinal cord cross sections were paraffin embedded and stained with the indicated histochemical stains or the anti-CD3 antibody. Bar, 500 μm. (C) Higher magnification of the Luxol fast blue staining is shown. Bar, 200 μm. (D) Quantification of the number of CD3-positive cells per cross section in TL1A KO and WT animals on day 27 after immunization. Images were analyzed as described in Materials and methods. Results are shown for seven individual animals in each group and one unimmunized WT animal (untr). Symbols represent the number of CD3-positive cells per cross section; horizontal bars indicate means. (E and F) Kinetic analysis of CNS-infiltrating T cells. CNS-infiltrating leukocytes were isolated as described in Materials and methods. (E) Representative FACS plots of CD45 and CD4 staining (gated on CD45+ cells) are shown for the WT CNS untreated (left) and at day 17 after immunization (right), with equal numbers of events plotted (percentages are shown). (F) Percentage of CD45+CD4+ cells in the CNS of WT (white bars) and TL1A KO (gray bars) mice at the indicated days after immunization. Cells are gated as in Fig. 7 E. Five to seven animals per group are shown; the black bar represents untreated WT mice. The reduction seen in the KO mice is statistically significant for TL1A KO over the course of the experiment (P = 0.021, as determined by two-way analysis of variance). Error bars represent SD. (G) A reduced number of cytokine-expressing CD4+ T cells in TL1AKO CNS after MOG-EAE induction. CNS cell isolates of WT and TL1A KO mice (pools from six animals for each group) were analyzed on day 17 after disease induction. The absolute numbers of cytokine-positive CD4+ cells were determined by intracellular cytokine staining. Results are representative of two independent experiments.
Figure 8.
Figure 8.
Reduced T cell Priming in MOG-immunized TL1A KO mice. WT and TL1A KO mice were primed with MOG-CFA, and draining lymph nodes and spleen were harvested on day 10. Single-cell suspensions were stimulated with PMA plus ionomycin with Golgi Plug for 4 h, stained, and analyzed by flow cytometry. Percentages of IL-17– and/or IFN-γ–secreting cells among CD4+ cells are shown. Values shown are means ± SEM (n = 12 mice per group). Results are compiled from two experiments with similar results. Differences between WT and KO mice are significant for each of the cytokine-expressing populations (IL-17+, P = 0.004; IFN-γ+, P = 0.002; IL-17+IFN-γ, P = 0.019; IFN-γ+IL-17, P = 0.011; and IL-17+IFN-γ+, P = 0.005, as determined by the Student's t test).
Figure 9.
Figure 9.
EAE induced by adoptive transfer of MOG-specific Th17 cells is dependent on TL1A. CD4+ T cells from MOG-primed WT animals were expanded in vitro in the presence of MOG peptide and IL-23 and adoptively transferred into WT and TL1A KO mice. (A) EAE clinical course in WT and TL1A KO mice (n = 11–12 mice per group). Results shown are compiled from two independent experiments. Disease severity was significantly reduced in KO mice (WT vs. KO mean cumulative score, P = 0.04; and mean maximal score, P = 0.05, as determined by the Mann Whitney nonparametric test), with no difference in disease incidence (WT, 9 out of 11 mice; KO, 10 out of 12 mice). Disease onset tended to be delayed (P = 0.06, as determined by the Student's two-tailed t test). (B) Mononuclear infiltrating cells from the CNS of WT and TL1A KO mice (pools of five animals) at day 24 after adoptive transfer were restimulated with PMA plus ionomycin and analyzed by intracellular cytokine staining. The absolute number of IL-17– and/or IFN-γ–expressing CD4+ T cells are shown.

References

    1. Dong, C., and R.A. Flavell. 2000. Cell fate decision: T-helper 1 and 2 subsets in immune responses. Arthritis Res. 2:179–188. - PMC - PubMed
    1. Glimcher, L.H., and K.M. Murphy. 2000. Lineage commitment in the immune system: the T helper lymphocyte grows up. Genes Dev. 14:1693–1711. - PubMed
    1. Dong, C. 2006. Diversification of T-helper-cell lineages: finding the family root of IL-17-producing cells. Nat. Rev. Immunol. 6:329–333. - PubMed
    1. Weaver, C.T., L.E. Harrington, P.R. Mangan, M. Gavrieli, and K.M. Murphy. 2006. Th17: an effector CD4 T cell lineage with regulatory T cell ties. Immunity. 24:677–688. - PubMed
    1. Bettelli, E., M. Oukka, and V.K. Kuchroo. 2007. TH-17 cells in the circle of immunity and autoimmunity. Nat. Immunol. 8:345–350. - PubMed

Publication types

MeSH terms