

Population genetic analysis of shotgun assemblies of genomic sequences from multiple individuals
- PMID: 18411405
- PMCID: PMC2493391
- DOI: 10.1101/gr.074187.107
Population genetic analysis of shotgun assemblies of genomic sequences from multiple individuals
Abstract
We introduce a simple, broadly applicable method for obtaining estimates of nucleotide diversity from genomic shotgun sequencing data. The method takes into account the special nature of these data: random sampling of genomic segments from one or more individuals and a relatively high error rate for individual reads. Applying this method to data from the Celera human genome sequencing and SNP discovery project, we obtain estimates of nucleotide diversity in windows spanning the human genome and show that the diversity to divergence ratio is reduced in regions of low recombination. Furthermore, we show that the elevated diversity in telomeric regions is mainly due to elevated mutation rates and not due to decreased levels of background selection. However, we find indications that telomeres as well as centromeres experience greater impact from natural selection than intrachromosomal regions. Finally, we identify a number of genomic regions with increased or reduced diversity compared with the local level of human-chimpanzee divergence and the local recombination rate.
Figures
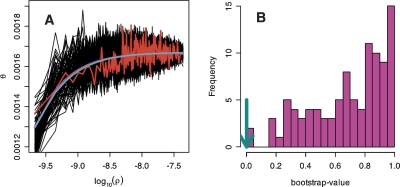
 /d for the bins was plotted against the average recombination rate as log(ρ), where ρ is the number of recombinants per base per meiosis (red line). For these binned data, we also estimated the parameters for a simple hitchhiking model (HH, cyan line) and a simple background selection model (BS, purple line). /d vs. log(ρ) is also drawn for 100 simulated data sets under the BS-model (black lines). (B) For 100 data sets simulated under the BS-model, we estimated the parameters for the HH- and BS-models. Given these new estimates, we counted how often the BS-model fits better than the HH-model by using the sum of squares and bootstrapping over the bins. In most cases, the BS-model fit consistently better (bootstrap-value closer to 1); but for the real data, the HH-model gave a slightly better fit (cyan arrow).
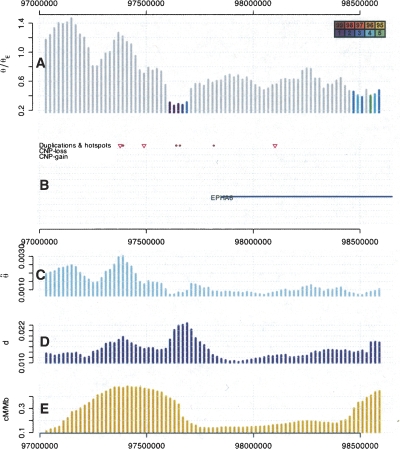 /θE on chromosome 3. Vertical bars represent the values for a 100-kb window positioned at their midpoint. (A) Plotted is /θE, whereas the expected value is either under a neutral or a background selection model, whatever was more conservative. The colors of the bars indicate whether /θE lie outside of a 95%, 96%, etc., confidence interval obtained through simulations. (B) Pink triangles mark recombination hotspots; blue lines correspond to genes from the RefSeq gene track of the UCSC genome browser. The closest gene is EPHA6. (C–E) The values for , human–chimpanzee divergence, and the recombination rate in cM/Mb are plotted.
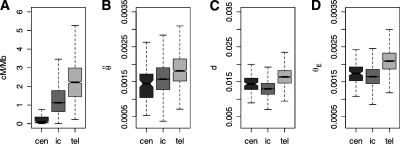 (B), human–chimpanzee divergence (C), and hence, also in the predicted value θE (D). However, for centromeres and telomeres is smaller than θE.
References
-
- Altshuler D., Pollara V.J., Cowles C.R., Van Etten W.J., Baldwin J., Linton L., Lander E.S. An SNP map of the human genome generated by reduced representation shotgun sequencing. Nature. 2000;407:513–516. - PubMed
-
- Andolfatto P. Adaptive evolution of non-coding DNA in Drosophila. Nature. 2005;437:1149–1152. - PubMed
Publication types
MeSH terms
Grants and funding
LinkOut - more resources
Full Text Sources