. 2008 May;8(5):1492-500.
doi: 10.1021/nl080496z. Epub 2008 Apr 16.

Modulation of in vivo tumor radiation response via gold nanoshell-mediated vascular-focused hyperthermia: characterizing an integrated antihypoxic and localized vascular disrupting targeting strategy

Affiliations

Modulation of in vivo tumor radiation response via gold nanoshell-mediated vascular-focused hyperthermia: characterizing an integrated antihypoxic and localized vascular disrupting targeting strategy

Parmeswaran Diagaradjane et al. Nano Lett. 2008 May.

Abstract

We report noninvasive modulation of in vivo tumor radiation response using gold nanoshells. Mild-temperature hyperthermia generated by near-infrared illumination of gold nanoshell-laden tumors, noninvasively quantified by magnetic resonance temperature imaging, causes an early increase in tumor perfusion that reduces the hypoxic fraction of tumors. A subsequent radiation dose induces vascular disruption with extensive tumor necrosis. Gold nanoshells sequestered in the perivascular space mediate these two tumor vasculature-focused effects to improve radiation response of tumors. This novel integrated antihypoxic and localized vascular disrupting therapy can potentially be combined with other conventional antitumor therapies.


Figures

Figure 1
Figure 1
(a) Absorption spectra of gold nanoshells (silica core diam: 120 ± 12 nm; gold shell diam: 12 ± 3 nm), (b) temperature profile of tumor tissue measured by thermocouples, (c) MRTI images of tumor tissues at various time periods, and (d) temperature profile in tumor tissue estimated from the MRTI at various time points during laser illumination at ~24 h after gold nanoshell injection. The red dotted line in (c) and (d) represents the best-fit line.
Figure 2
Figure 2
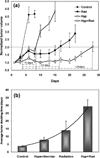
(a) Normalized tumor volume plot of control, hyperthermia, radiation, and thermoradiotherapy groups showing the mean ± SE values at different time periods after the initiation of each treatment and (b) the corresponding tumor doubling time after each treatment.
Figure 3
Figure 3
T1-weighted (a) precontrast, (b) prehyperthermia DCE-MRI, (c) posthyperthermia DCE-MRI images of tumor, and (d–f) the corresponding 3D pixel intensity distribution profile. Enhanced contrast (bright tumor center) observed in posthyperthermia DCE-MRI when compared to prehyperthermia shows increased perfusion after gold nanoshell-mediated hyperthermia. Pre- and posthyperthermia contrast uptake estimated from the ROI encompassing the tumor core and whole tumor is illustrated in (g) and (h), respectively.
Figure 4
Figure 4
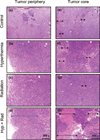
H and E staining of tumor (a–d) periphery and (e–h) core, tissues from control, hyperthermia, radiation, and thermoradiotherapy treated groups. The black arrows in (e–h) represents the regions of necrosis in the tumor center and the blue arrow in (d) represents the depth of necrosis from the tumor periphery. Representative scale bar is shown in the bottom image of each column.
Figure 5
Figure 5
Immunofluorescence staining of control, hyperthermia, radiation, and thermoradiotherapy treated tumors showing hypoxia, cell proliferation (a–d), and hypoxia, perfusion in tumor periphery (e–h), and tumor core (i–l), respectively. Red, blue, and green fluorescence represents cell proliferation, perfusion, and hypoxic regions in tumors. Patchy hypoxic region seen in (l) is attributed to the vascular disruption effect induced by gold nanoshell-mediated thermoradiotherapy. Scale bars are represented in the bottom image of each column.
Figure 6
Figure 6
(a) Immunofluorescence staining for the microvessel density in control, hyperthermia, radiation, and thermoradiotherapy treated tumors showing the vessel distribution in tumor periphery (column 1) and tumor center (column 2). (b) Bar chart representing mean ± SE of blood vessels in tumor periphery and tumor core for different treatment groups. (c) SEM images showing the low and high magnification images of gold nanoshell distribution near the perivascular regions in tumors before (row 1: low magnification: 1000×; high magnification: 7000×) and after (row 2: low magnification: 2000×; high magnification: 5000×) gold nanoshell-mediated hyperthermia. The white arrows show the gold nanoshell distribution.

References

    1. Greish K. J. Drug Targeting. 2007;15(7–8):457–464. - PubMed
    1. Jain RK. Annu. Rev. Biomed. Eng. 1999;1:241–263. - PubMed
    1. Brigger I, Dubernet C, Couvreur P. Adv. Drug Delivery Rev. 2002;54(5):631–651. - PubMed
    1. Hashizume H, Baluk P, Morikawa S, McLean JW, Thurston G, Roberge S, Jain RK, McDonald DM. Am. J. Pathol. 2000;156(4):1363–1380. - PMC - PubMed
    1. Hirsch LR, Stafford RJ, Bankson JA, Sershen SR, Rivera B, Price RE, Hazle JD, Halas NJ, West JL. Proc. Natl. Acad. Sci. U.S.A. 2003;100(23):13549–13554. - PMC - PubMed

Publication types