

Selective binding of sterol regulatory element-binding protein isoforms and co-regulatory proteins to promoters for lipid metabolic genes in liver
- PMID: 18413311
- PMCID: PMC2414284
- DOI: 10.1074/jbc.M800391200
Selective binding of sterol regulatory element-binding protein isoforms and co-regulatory proteins to promoters for lipid metabolic genes in liver
Abstract
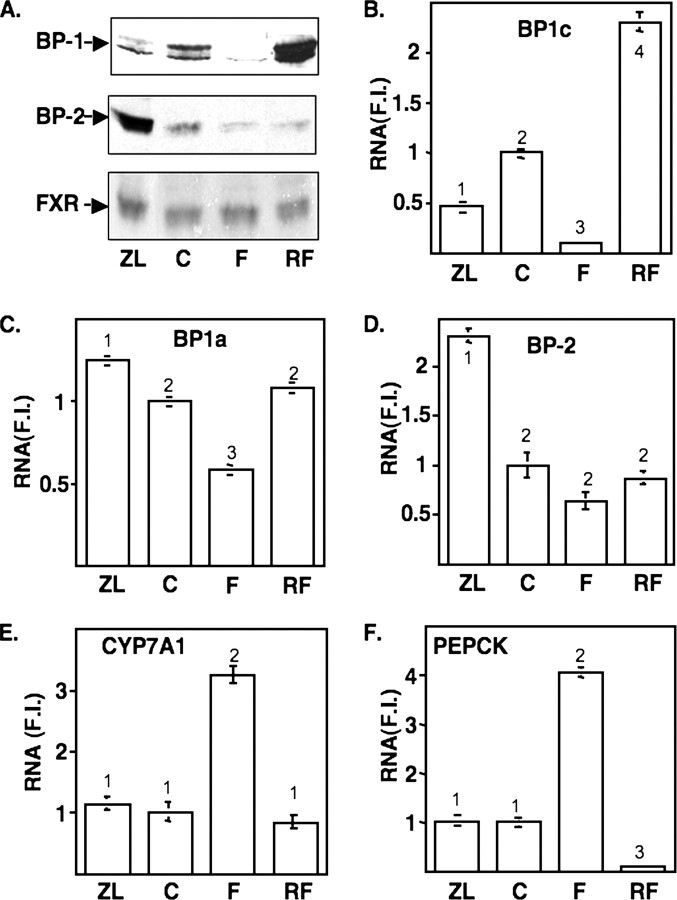
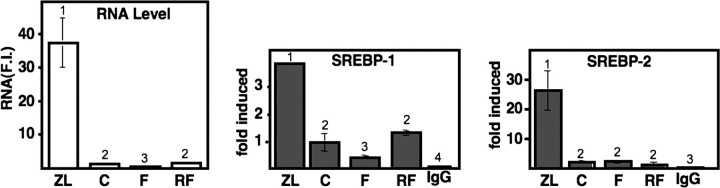
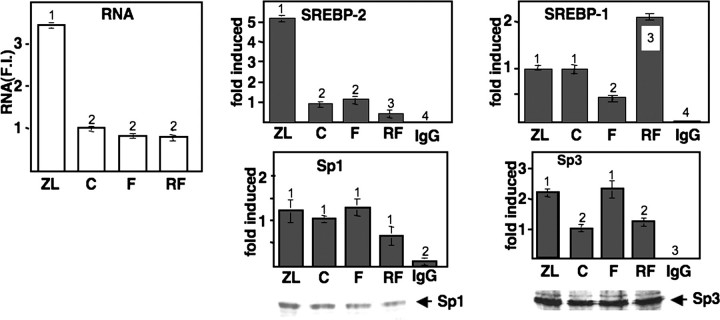
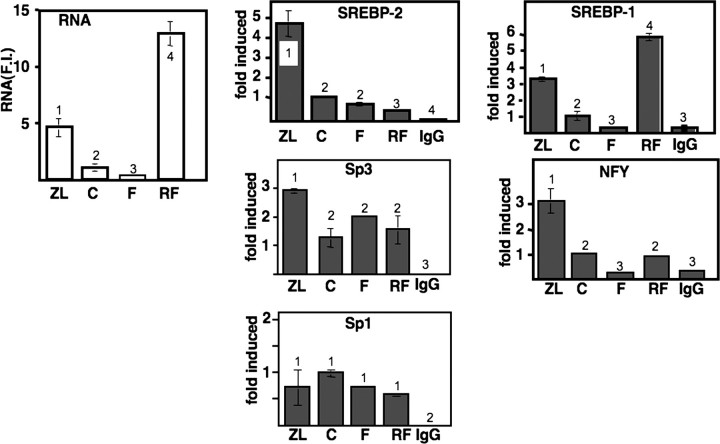
Mice were subjected to different dietary manipulations to selectively alter expression of hepatic sterol regulatory element-binding protein 1 (SREBP-1) or SREBP-2. mRNA levels for key target genes were measured and compared with the direct binding of SREBP-1 and -2 to the associated promoters using isoform specific antibodies in chromatin immunoprecipitation studies. A diet supplemented with Zetia (ezetimibe) and lovastatin increased and decreased nuclear SREBP-2 and SREBP-1, respectively, whereas a fasting/refeeding protocol dramatically altered SREBP-1 but had modest effects on SREBP-2 levels. Binding of both SREBP-1 and -2 increased on promoters for 3-hydroxy-3-methylglutaryl-CoA reductase, fatty-acid synthase, and squalene synthase in livers of Zetia/lovastatin-treated mice despite the decline in total SREBP-1 protein. In contrast, only SREBP-2 binding was increased for the low density lipoprotein receptor promoter. Decreased SREBP-1 binding during fasting and a dramatic increase upon refeeding indicates that the lipogenic "overshoot" for fatty-acid synthase gene expression known to occur during high carbohydrate refeeding can be attributed to a similar overshoot in SREBP-1 binding. SREBP co-regulatory protein recruitment was also increased/decreased in parallel with associated changes in SREBP binding, and there were clear distinctions for different promoters in response to the dietary manipulations. Taken together, these studies reveal that there are alternative molecular mechanisms for activating SREBP target genes in response to the different dietary challenges of Zetia/lovastatin versus fasting/refeeding. This underscores the mechanistic flexibility that has evolved at the individual gene/promoter level to maintain metabolic homeostasis in response to shifting nutritional states and environmental fluctuations.
Figures


Similar articles
-
Sterol regulatory element-binding protein-1 as a key transcription factor for nutritional induction of lipogenic enzyme genes.J Biol Chem. 1999 Dec 10;274(50):35832-9. doi: 10.1074/jbc.274.50.35832. J Biol Chem. 1999. PMID: 10585467
-
Diminished hepatic response to fasting/refeeding and liver X receptor agonists in mice with selective deficiency of sterol regulatory element-binding protein-1c.J Biol Chem. 2002 Mar 15;277(11):9520-8. doi: 10.1074/jbc.M111421200. Epub 2002 Jan 8. J Biol Chem. 2002. PMID: 11782483
-
Regulation of human cytochrome P450 4F2 expression by sterol regulatory element-binding protein and lovastatin.J Biol Chem. 2007 Feb 23;282(8):5225-36. doi: 10.1074/jbc.M608176200. Epub 2006 Dec 1. J Biol Chem. 2007. PMID: 17142457
-
Regulation of lipid homeostasis by the bifunctional SREBF2-miR33a locus.Cell Metab. 2011 Mar 2;13(3):241-7. doi: 10.1016/j.cmet.2011.02.004. Cell Metab. 2011. PMID: 21356514 Free PMC article. Review.
-
[Identification of Food-derived Bioactive Components with Physiological Effects].Yakugaku Zasshi. 2025;145(1):23-28. doi: 10.1248/yakushi.24-00173-2. Yakugaku Zasshi. 2025. PMID: 39756920 Review. Japanese.
Cited by
-
The yeast anaerobic response element AR1b regulates aerobic antifungal drug-dependent sterol gene expression.J Biol Chem. 2013 Dec 6;288(49):35466-77. doi: 10.1074/jbc.M113.526087. Epub 2013 Oct 25. J Biol Chem. 2013. PMID: 24163365 Free PMC article.
-
Adipogenic and energy metabolism gene networks in longissimus lumborum during rapid post-weaning growth in Angus and Angus x Simmental cattle fed high-starch or low-starch diets.BMC Genomics. 2009 Mar 31;10:142. doi: 10.1186/1471-2164-10-142. BMC Genomics. 2009. PMID: 19335898 Free PMC article.
-
SREBPs: metabolic integrators in physiology and metabolism.Trends Endocrinol Metab. 2012 Feb;23(2):65-72. doi: 10.1016/j.tem.2011.10.004. Epub 2011 Dec 7. Trends Endocrinol Metab. 2012. PMID: 22154484 Free PMC article. Review.
-
Protein phosphatase 2A (PP2A) regulates low density lipoprotein uptake through regulating sterol response element-binding protein-2 (SREBP-2) DNA binding.J Biol Chem. 2014 Jun 13;289(24):17268-79. doi: 10.1074/jbc.M114.570390. Epub 2014 Apr 26. J Biol Chem. 2014. PMID: 24770487 Free PMC article.
-
Sterol regulatory element binding protein 1a regulates hepatic fatty acid partitioning by activating acetyl coenzyme A carboxylase 2.Mol Cell Biol. 2009 Sep;29(17):4864-72. doi: 10.1128/MCB.00553-09. Epub 2009 Jun 29. Mol Cell Biol. 2009. PMID: 19564420 Free PMC article.
References
Publication types
MeSH terms
Substances
Grants and funding
LinkOut - more resources
Full Text Sources
Research Materials
