. 2008 Apr 15;22(8):1082-92.
doi: 10.1101/gad.463408.

Budding yeast RNA polymerases I and II employ parallel mechanisms of transcriptional termination

Affiliations

Budding yeast RNA polymerases I and II employ parallel mechanisms of transcriptional termination

Junya Kawauchi et al. Genes Dev. .

Abstract

Both RNA polymerase I and II (Pol I and Pol II) in budding yeast employ a functionally homologous "torpedo-like" mechanism to promote transcriptional termination. For two well-defined Pol II-transcribed genes, CYC1 and PMA1, we demonstrate that both Rat1p exonuclease and Sen1p helicase are required for efficient termination by promoting degradation of the nascent transcript associated with Pol II, following mRNA 3' end processing. Similarly, Pol I termination relies on prior Rnt1p cleavage at the 3' end of the pre-rRNA 35S transcript. This is followed by the combined actions of Rat1p and Sen1p to degrade the Pol I-associated nascent transcript that consequently promote termination in the downstream rDNA spacer sequence. Our data suggest that the previously defined in vitro Pol I termination mechanism involving the action of the Reb1p DNA-binding factor to "road-block" Pol I transcription close to the termination region may have overlooked more complex in vivo molecular processes.


Figures

Figure 1.
Figure 1.
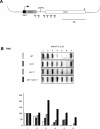
Role of Reb1p, Rpa12p, and Rnt1p in Pol I transcription termination. (A) Diagram of the rDNA repeat and the Pol II-transcribed locus SIN3. The primary rRNA transcript is indicated by a dashed line. The external transcribed sequence (ETS) and internal (ITS) transcribed sequence are shown. The triangle indicates the 3′ cleavage site by Rnt1p. Vertical arrows to the left and right of the Reb1p-binding site (Reb1BS) denote the +93 primary termination site and the +250 fail-safe termination site, respectively. The black oval denotes the autonomously replicating sequence (ARS). The URA3 cassette (shown above) is inserted in place of the indicated terminator region of all rDNA repeats in strain TAK401. Horizontal bars denote the location of the primers and probes used in ChIP (B) and TRO (C,D) analyses. Exact locations and sizes of the PCR products are described in Supplemental Table 3. (B) ChIP analysis (using anti-HA) of Pol I and Reb1p binding across the Pol I-transcribed rDNA loci and SIN3 promoter. High Reb1p signals are evident on the promoter Reb1-binding sites on rDNA and SIN3 promoter, but only background signal is detected on the Reb1 terminator site. Quantification of real-time PCR data was carried out as detailed in the Materials and Methods. All of the ChIP analyses were repeated (n = 2–4), and average data sets are presented. Error bars show SD throughout. (C) Deletion of the Reb1BS-containing rDNA terminator impairs transcription termination. TRO hybridization profiles are presented for the terminator Δ strain (TAK401) and isogenic wild type (WT) (TAK314). Location of M13 or oligonucleotide probes are shown in A. Probes 3′, 4′, and 5′ cover the URA3 sequence in TAK401, the same distance from the end of 35S as corresponding probes 3, 4, and 5. (A) Actin-positive control; (M) M13-negative control (lacking rDNA sequence). Signals are corrected for the A content of each probe (TRO labeled with 32P-UTP), and relative values against probe 2 are shown in the right panel. (D) Loss of Rpa12 or Rnt1 diminishes Pol I transcription termination. TRO hybridization profiles are presented for the rpa12Δ and rnt1Δ strains compared with isogenic parental strains. Locations of M13 probes are shown in A. Quantification and controls are the same as in C.
Figure 2.
Figure 2.
Rat1p and Sen1p are both required for efficient Pol II termination at the CYC1 locus. (A) Diagram of the pGCYC1 plasmid transformed into each of the indicated strains. The CYC1 gene promoter is replaced by that of GAL1, and the UTR1 promoter is deleted (cross). M13 probes used in TRO analysis are indicated by horizontal bars. The position of the CYC1 poly(A) site is indicated. (B) CYC1 gene TRO profiles for pGCYC1-transformed rat1-1, sen1-1, rat1-1 sen1-1, and isogenic wild-type strains. Quantitation of the TRO experiments is shown below. Values are plotted relative to probe 1, allowing direct comparison between the different strains.
Figure 3.
Figure 3.
Role of Rat1p and Sen1p in transcription termination at the PMA1 locus. (A) Diagram of PMA1 and the following LEU1 genes. Two alternative poly(A) sites of PMA1 are indicated. Horizontal bars denote the location of primers used in the ChIP (B) and RT–PCR (C) analyses. (B) Pol II ChIP over the PMA1 terminator region. Cells from the rat1-1, sen1-1, and rat1-1 sen1-1 strains or from the isogenic wild type were harvested 2.5 h after shift at 37°C. ChIP values are expressed relative to the signal obtained with oligos p2 (see A). (M) The inactive MUC1 gene, used as a negative control. (C) RT–PCR analysis of transcript downstream from the PMA1 poly(A) sites. Total RNA was reverse-transcribed with specific RT primers (p5R, p8R, p9R, p10R, and p11R) and PCR-amplified with the primers indicated. After 3 h at 37°C, the transcripts downstream from the poly(A) are stabilized in the rat1-1, sen1-1, and rat1-1 sen1-1 mutant strains with respect to the wild type. The lower bands seen in the p9R, p10R, and p11R lanes are unused primer dimers.
Figure 4.
Figure 4.
Rat1p and Sen1p are associated with rDNA chromatin and cooperatively degrade the 3′ product of Rnt1p cleavage. (A) Location of the primers and probes used in ChIP, RT–PCR, and TRO analyses. A map of an rDNA repeat is shown as in Figure 1A with the exact positions of the probes and primers described in Supplemental Table 3. (B) ChIP analysis of TAP-Rat1p and TAP-Sen1p yeast strains. Both the proteins associate with rDNA chromatin accumulating over the terminator region. The signals obtained are expressed relative to the isogenic nontagged strain. Pol II-transcribed CYC1 gene is shown as a control. (C) RT–PCR analysis of transcript downstream from the Rnt1p cleavage site. Extracted total RNA was reverse-transcribed with strand-specific RT primers (p1–p6) and PCR-amplified with the primer set shown in A. After 3 h at 37°C, the transcript downstream from the Rnt1p site is stabilized in the rat1-1 and/or sen1-1 strains. The asterisk on the right indicates a nonspecific PCR product. Lower bands are unused primer dimers.
Figure 5.
Figure 5.
Rat1 and Sen1 are involved in Pol I transcription termination. (A) TRO analysis of rat1-1 and/or sen1-1 strains. Cells were harvested at three different time points (2.5, 3.5, and 5.0 h) after shift at 37°C. The M13 probes are indicated in Figure 4A. Signal intensity was normalized to probe 2, and quantification of the profiles obtained is shown in the bottom panel. The top panel shows a representative TRO hybridization profile (3.5 h after temperature shift). (B) Pol I occupancy over the terminator region is increased in rat1-1 and rat1-1 sen1-1 mutants. ChIP analysis was conducted with 3HA-Pol I strains (Rpa14p subunit). Cells from the rat1-1, sen1-1, rat1-1 sen1-1 mutant strains or from the isogenic wild-type strain were harvested 0, 3, or 5 h after temperature shift. ChIP values are expressed relative to the signal obtained with oligos 25,3 (see Fig. 4A). The Pol II-transcribed ISY1 gene is shown as a negative control.
Figure 6.
Figure 6.
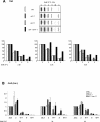
Pol I termination profile is not influenced by CUTs. (A) Inhibition of CUT synthesis does not influence Pol I transcription termination. pTEF:KANR-transfected rat1-1 sen1-1 and wild-type strains were treated with α-amanitin (50 μg/mL) before TRO reaction, and profiles were compared with those from untreated cells. Probes for Pol I transcription (2, 3, 4, and 5) are the same as in Figure 5A. Probe K1 shows the signal from pTEF: KANR, transcribed by Pol II. Note that Pol II transcription is repressed after α-amanitin treatment. (B) Sir2 deletion does not influence Pol I transcription termination. Probes are shown in Figure 1A. The TRO profile of the sir2Δ mutant strain has no significant difference from that obtained with the parental strain.
Figure 7.
Figure 7.
“Torpedo” model for Pol I transcription termination. Nascent rRNA transcribed by Pol I is cleaved by Rnt1p (gray scissors) cotranscriptionally. This releases the pre-rRNA for processing into mature rRNAs. 5′ → 3′ exonuclease Rat1p is recruited to the 5′ end of the downstream Rnt1p cleavage product. Here it degrades the Pol I-associated transcript assisted by the helicase activity of Sen1p. Eventually, the Rat1p torpedo catches up with Pol I and induces termination.

Similar articles

Cited by

References

    1. Alen C., Kent N.A., Jones H.S., O’Sullivan J., Aranda A., Proudfoot N.J. A role for chromatin remodeling in transcriptional termination by RNA polymerase II. Mol. Cell. 2002;10:1441–1452. - PubMed
    1. Archambault J., Friesen J.D. Genetics of eukaryotic RNA polymerases I, II, and III. Microbiol. Rev. 1993;57:703–724. - PMC - PubMed
    1. Arigo J.T., Eyler D.E., Carroll K.L., Corden J.L. Termination of cryptic unstable transcripts is directed by yeast RNA-binding proteins Nrd1 and Nab3. Mol. Cell. 2006;23:841–851. - PubMed
    1. Birse C.E., Minvielle-Sebastia L., Lee B.A., Keller W., Proudfoot N.J. Coupling termination of transcription to messenger RNA maturation in yeast. Science. 1998;280:298–301. - PubMed
    1. Braglia P., Percudani R., Dieci G. Sequence context effects on oligo(dT) termination signal recognition by Saccharomyces cerevisiae RNA polymerase III. J. Biol. Chem. 2005;280:19551–19562. - PubMed

Publication types

MeSH terms