. 2008 Apr 15;68(8):2641-51.
doi: 10.1158/0008-5472.CAN-07-5590.

Analysis of the mechanisms mediating tumor-specific changes in gene expression in human liver tumors

Affiliations

Analysis of the mechanisms mediating tumor-specific changes in gene expression in human liver tumors

Luis G Acevedo et al. Cancer Res. .

Abstract

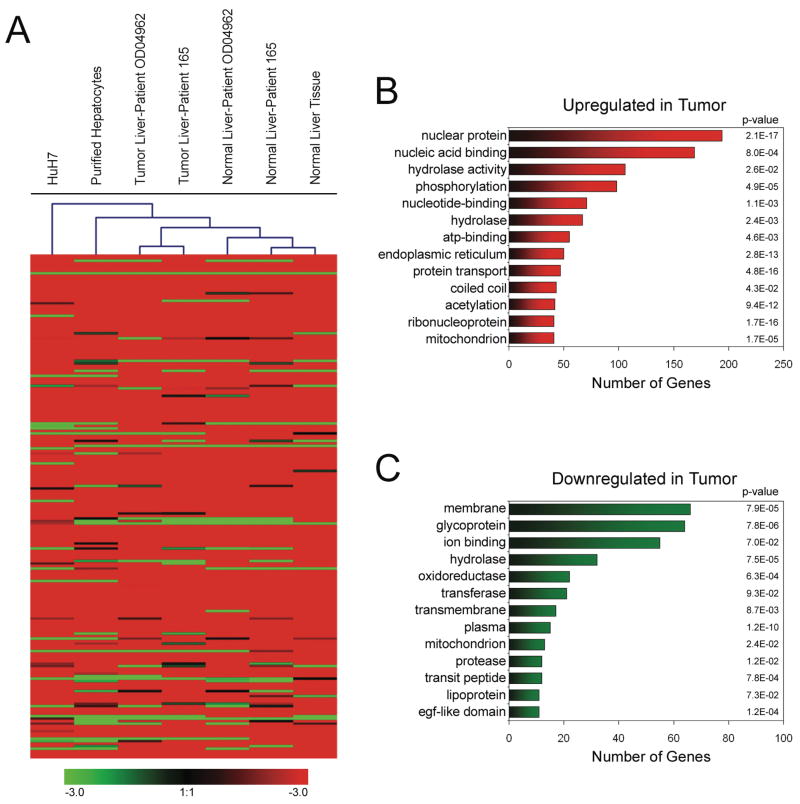
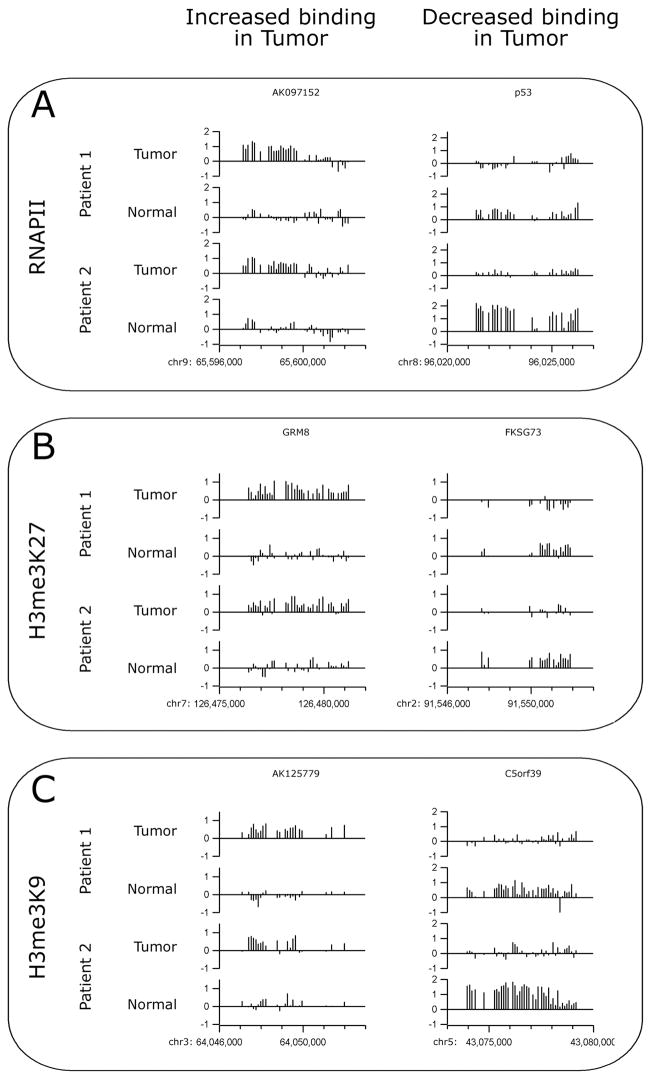
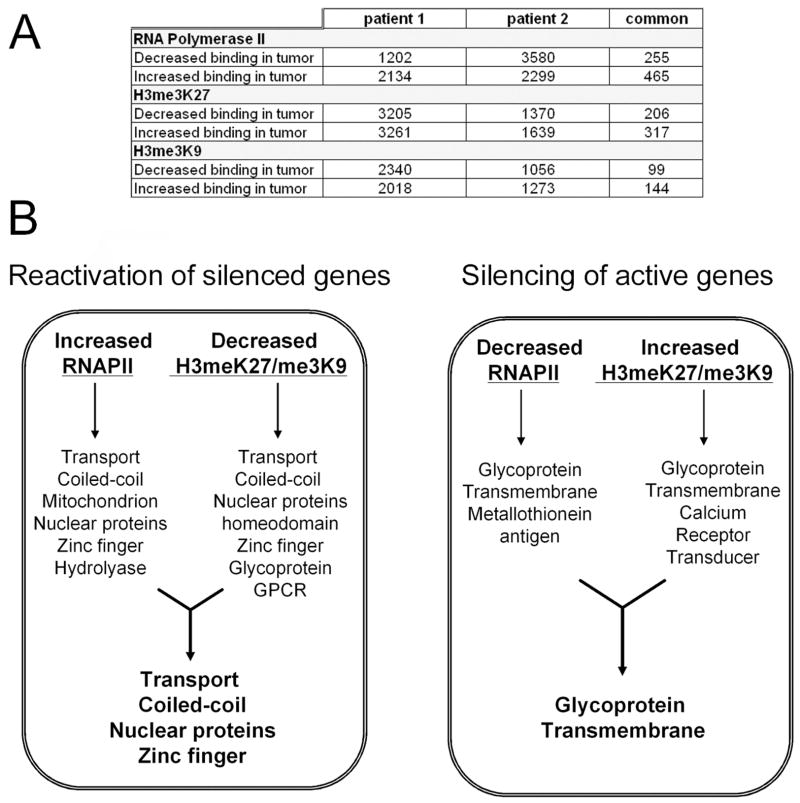
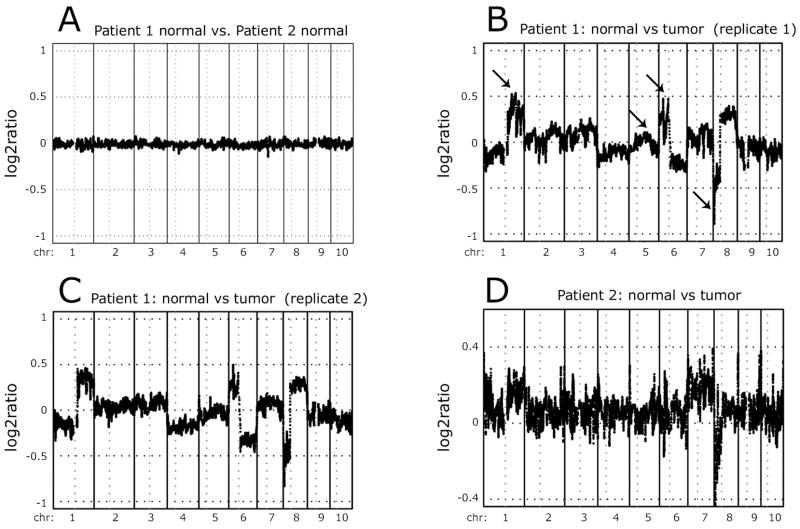
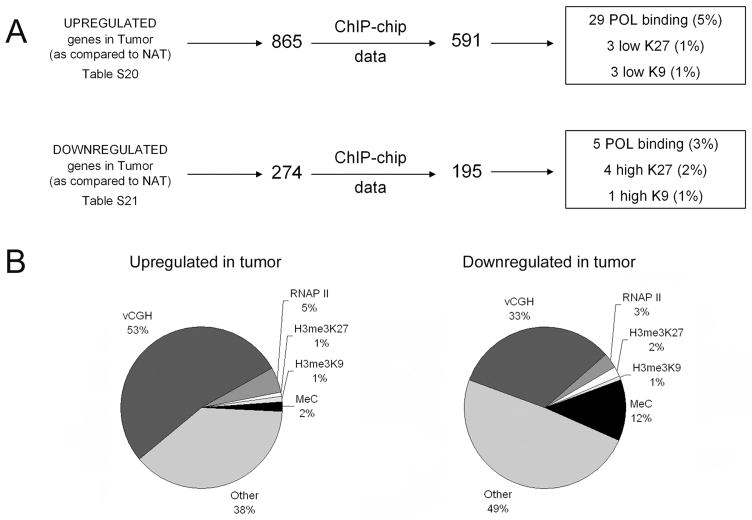
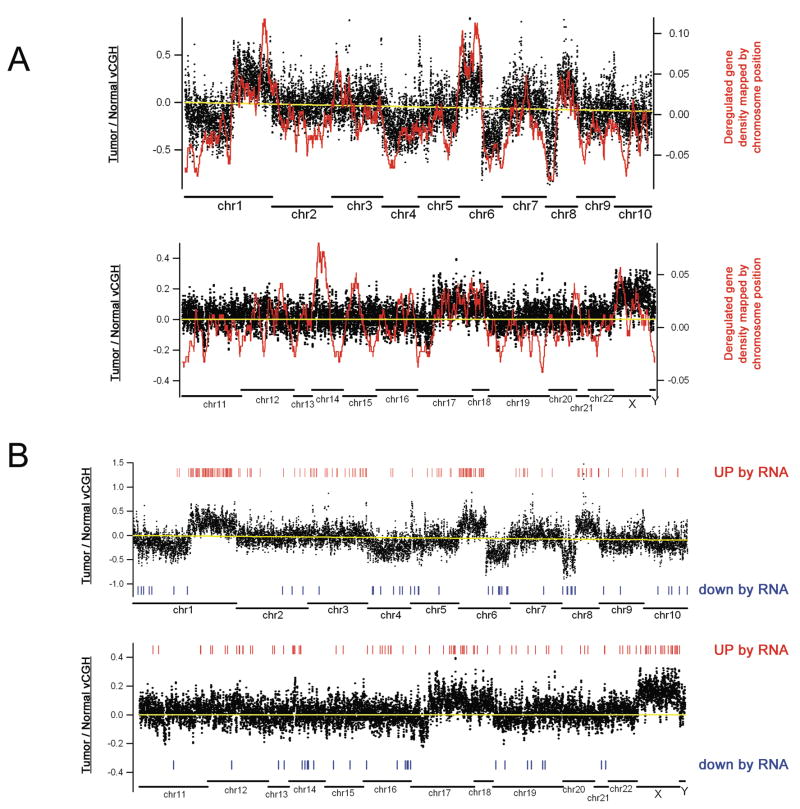
There is widespread interest in efficient characterization of differences between tumor and normal samples. Here, we show an effective methodology for genome-scale characterization of tumors. Using matched normal and tumor samples from liver cancer patients, as well as non-cancer-related normal liver tissue, we first determined changes in gene expression as monitored on RNA expression arrays. We identified several hundred mRNAs that were consistently changed in the tumor samples. To characterize the mechanisms responsible for creation of the tumor-specific transcriptome, we performed chromatin immunoprecipitation on microarray experiments to assay binding of RNA polymerase II, H3me3K27, and H3me3K9 and DNA methylation in 25,000 promoter regions. These experiments identified changes in active and silenced regions of the genome in the tumor cells. Finally, we used a "virtual comparative genomic hybridization" method to identify copy number alterations in the tumor samples. Through comparison of RNA polymerase II binding, chromatin structure, DNA methylation, and copy number changes, we suggest that the major contributor to creation of the liver tumor transcriptome was changes in gene copy number.


Figures

Figure 1
Figure 1. Analysis of the HCC transcriptome
(A) RNA Hierarchical Clustering. RNA was prepared from the indicated samples of normal and tumor liver, from purified hepatocytes, and from Huh-7 hepatoma cells and analyzed using Illumina Sentrix Expression Beadchips. Genesis 1.7.2 software (http://genome.tugraz.at/genesisclient/genesisclient_description.shtml) was used to cluster the different samples into related subgroups. Red indicates higher expression in the tumor sample. Although all the genes were used for the cluster analysis, only the highest expressed genes are shown. (B) Gene ontology analysis of genes upregulated in HCC. (C) Gene ontology analysis of genes downregulated in HCC.
Figure 2
Figure 2. Examples of normal and tumor ChIP-chip hybridization patterns
Examples of the hybrdization patterns for promoters that show increased or decreased binding of RNAPII (A), H3me3K27 (B), or H3me3K9 (C) are shown for the normal and tumor samples for both patients. Each vertical bar represents the enrichment of a single probe as a log2 ratio value (y axes) between the enriched ChIP sample and the Input sample.
Figure 3
Figure 3. Analysis of active vs. silenced promoters
(A) Shown are the numbers of promoters that show changes in binding of RNAPII, H3me3K7, or H3me3K9 in the normal vs tumor samples. (B). Shown are the gene ontology categories that show coordinate changes in RNAPII and H3me3K27 or H3me3K9 binding.
Figure 4
Figure 4. Analysis of copy number changes in HCC samples
vCGH analysis was performed comparing the normal DNA from both patients (A), the tumor vs. normal DNA from two separate ChIP-chip experiments for patient 1 (B, C), and the tumor vs. normal DNA for patient 2 (D). The y axes indicate the log2 ratio of the tumor to normal signals. Values above 0 represent copy number gains in the tumor and values below 0 represent copy number losses in the tumor. In panel B, the arrows indicate several of the amplified (chromosome 1q and 6p), deleted (chromosome 8p), or control (chromosome 5q) regions analyzed in Figure S6.
Figure 5
Figure 5. Overview of the mechanisms regulating the HCC transcriptome
(A) RNA and ChIP-chip platform comparisons. The RNAs which were commonly deregulated in the HCC samples were mapped to the NimbleGen arrays and then the number of each of these deregulated mRNAs that show changes in binding of RNAPolII, H3me3K27, or H3me3K9 was determined. (B) A pie chart demonstrating the percentages of deregulated mRNAs resulting from copy number changes (vCGH), changes in binding of RNAP II, H3me3K27, or H3me3K9, or changes in DNA methylation is shown for the mRNAs up and downregulated in liver tumors.
Figure 6
Figure 6. Mapping deregulated RNAs onto the vCGH pattern
(A) The mRNAs that are upregulated or downregulated in patient 1 are shown as a density plot in relation to the vCGH pattern from the same patient. Deregulated mRNA density was calculated based on chromosomal location by a sliding-window average algorithm. Positive values on the right Y axis represent up-regulated genes and negative values represent down-regulated genes. (B) The mRNAs that showed increased or decreased copy number in both patient 1 and patient 2 are mapped regulative to the vCGH pattern of patient 1.

References

    1. El-Serag HB, Rudolph KL. Hepatocellular carcinoma: Epidemiology and Molecular Carcinogenesis. Reviews in Basic and Clinical Gastroenterology. 2007;132:2557–76. - PubMed
    1. Chen X, Cheung ST, So S, et al. Gene expression patterns in human liver cancers. Mol Biol Cell. 2002;13:1929–39. - PMC - PubMed
    1. Xu L, Hui L, Wang S, et al. Expression profiling suggested a regulatory role of liver-enriched transcription factors in human hepatocellular carcinoma. Cancer Res. 2001;61:3176–81. - PubMed
    1. Graveel CR, Harkins-Perry SR, Acevedo LG, Farnham PJ. Identification and characterization of CRG-L2, a new marker for liver tumor development. Oncogene. 2003;22:1730–6. - PubMed
    1. Graveel CR, Jatkoe T, Madore SJ, Holt AL, Farnham PJ. Expression profiling and identification of novel genes in hapatocellular carcinomas. Oncogene. 2001;20:2704–12. - PubMed

Publication types

MeSH terms