. 2008 Apr 15;68(8):2878-84.
doi: 10.1158/0008-5472.CAN-07-6028.

Imaging transgene activity in vivo

Affiliations

Imaging transgene activity in vivo

Terence P F Gade et al. Cancer Res. .

Abstract

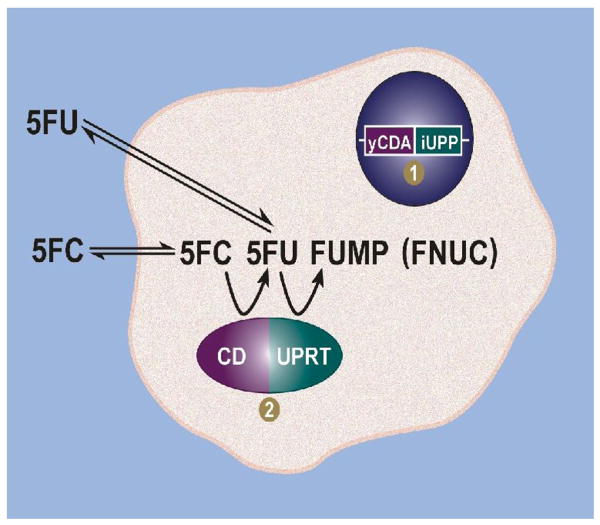
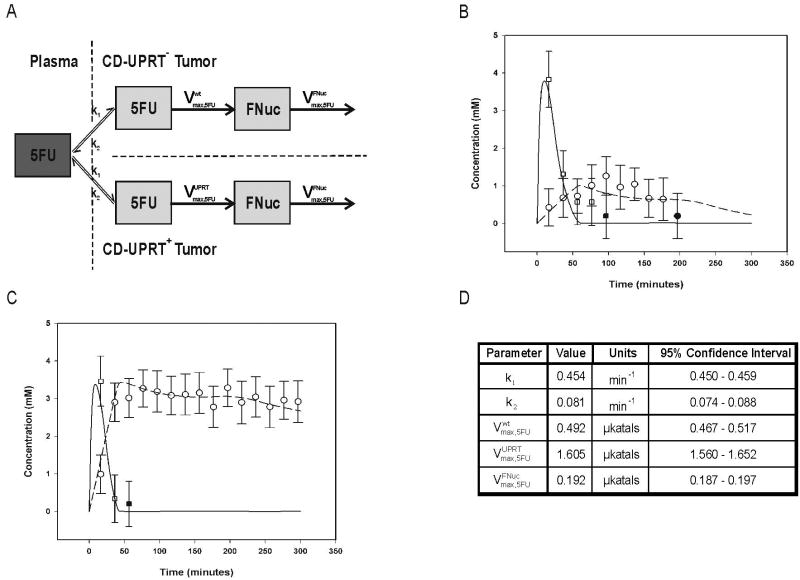
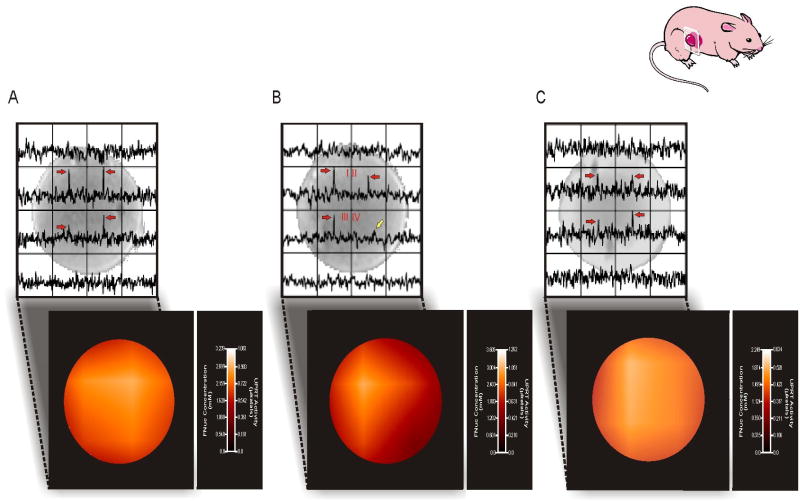
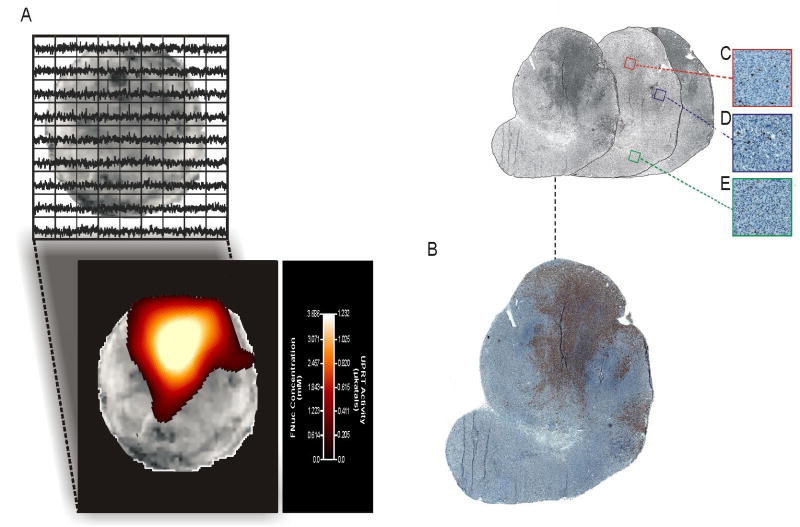
The successful translation of gene therapy for clinical application will require the assessment of transgene activity as a measure of the biological function of a therapeutic transgene. Although current imaging permits the noninvasive detection of transgene expression, the critical need for quantitative imaging of the action of the expressed transgene has not been met. In vivo magnetic resonance spectroscopic imaging (MRSI) was applied to quantitatively delineate both the concentration and activity of a cytosine deaminase-uracil phosphoribosyltransferase (CD-UPRT) fusion enzyme expressed from a transgene. MRSI enabled the generation of anatomically accurate maps of the intratumoral heterogeneity in fusion enzyme activity. We observed an excellent association between the CD-UPRT concentration and activity and the percentage of CD-UPRT(+) cells. Moreover, the regional levels of UPRT activity, as measured by imaging, correlated well with the biological affect of the enzyme. This study presents a translational imaging paradigm for precise, in vivo measurements of transgene activity with potential applications in both preclinical and clinical settings.


Figures

Figure 1
Figure 1
The CD-UPRT fusion enzyme can be monitored based on its metabolism of MR-visible probes to intracellularly entrapped MR-visible anabolites. Cells transduced with the yCDA-iUPP fusion gene (1) express the CD-UPRT enzyme (2). CD converts 5FC to 5FU, while UPRT anabolizes 5FU to fluorouridine monophosphate (FUMP). FUMP and other fluorinated nucleotides are indistinguishable by MRS and apppear as a single resonance on MR spectra that is designated as FNuc. As anions, these fluoronucleotides are unable to cross the cell membrane and are therefore trapped within the cell.
Figure 2
Figure 2
Pharmacokinetic modeling of 5FU anabolism in CD-UPRT- and CD-UPRT+ tumors based on 19FMRS data. (a) Schematic representation of the 5-compartment model used in the pharmacokinetic analysis of 5FU metabolism in CD-UPRT- and CD-UPRT+ W256 tumor xenografts. The rate constants k1 and k2 describe the transport of 5FU into and out of the xenografts, while the Vmax parameters reflect the maximal rates of conversion of 5FU to FNuc (Vmax,5FUwt,Vmax,5FUUPRT) and FNuc to higher molecular weight anabolites (Vmax,5FUFNuc). The transport of 5FU in and out of the cell was assumed to follow first order kinetics, whereas enzyme mediated conversions of 5FU to FNuc and all subsequent anabolism of FNuc were assumed to be saturable and therefore to follow Michaelis-Menten constraints. Pharmacokinetic analysis of 5FU and its anabolites in CD-UPRT- (b) and CD-UPRT+ (c) tumors. 19FMRS-determined concentrations of 5FU (□, –––) and FNuc (○, – – –) were fit to the pharmacokinetic model (Fig. 2a). The initial time points at which 5FU (■) and FNuc (●) concentrations became subthreshold are indicated to represent the uncertainty that was associated with these measurements.
Figure 3
Figure 3
In vivo imaging of transgene activity. 19FMRS images of FNuc (red arrows) and associated parametric maps of regional CD-UPRT levels and activity within CD-UPRT+ xenografts are shown. The inset cartoon indicates the slice orientation of the acquired images. 19FMRS enabled images demonstrating homogeneous enzyme activity (a) to be distinguished from xenografts exhibiting regional heterogeneities in CD-UPRT activity (b). An area of deficient CD-UPRT activity is evident within voxel IV and is underscored by the presence of unmetaboilized 5FU (yellow arrow). 19FMRSI was also able to discern CD-UPRT enzyme levels and activity in mixed xenografts grown from equal parts CD-UPRT+ and CD-UPRT- cells (c). Homogeneous CD-UPRT activity was seen; however, this activity is reduced in comparison to CD-UPRT+ tumors (a).
Figure 4
Figure 4
In vivo imaging of transgene activity provides an index of biological enzyme function. (a) 19FMRS image and associated parametric map demonstrating circumscribed regions of CD-UPRT levels and activity within a CD-UPRT+/CD-UPRT- co-transplanted tumor xenograft at a digital resolution of 1.8 mm × 1.8 mm. (b) The regional distribution of UPRT activity closely parallels the expression pattern of the CD-UPRT transgene as determined by immunohistochemical staining. Apoptotic indices measured in a contiguous slice of tumor tissue through staining for cleaved capase-3 demonstrated that regions with low, medium and high apoptotic indices (c, d, e) correlated well with transgene activity, (13.2 apoptotic cells/mm2 ± 2.9, 23.8 cells/mm2 ± 1.8 and 61.2 apoptotic cells/mm2 ± 2.4 respectively, P<0.0001).

References

    1. Benet LZ, Kroetz DL, Sheiner LB. Goodman & Gilman's Pharmacokinetics: The Dynamics of Drug Absorption, Distribution, and Elimination. 9th. New York: McGraw-Hill; 1996.
    1. Jain RK. The next frontier of molecular medicine: delivery of therapeutics. Nat Med. 1998;4:655–7. - PubMed
    1. Pislaru S, Janssens SP, Gersh BJ, Simari RD. Defining gene transfer before expecting gene therapy: putting the horse before the cart. Circulation. 2002;106:631–6. - PubMed
    1. Kamiya H, Akita H, Harashima H. Pharmacokinetic and pharmacodynamic considerations in gene therapy. Drug Discov Today. 2003;8:990–6. - PubMed
    1. Contag PR, Olomu IN, Stevenson DK, Contag CH. Bioluminescent indicators in living mammals. Nat Med. 1998;4:245–7. - PubMed

Publication types