

Personal and ambient air pollution exposures and lung function decrements in children with asthma
- PMID: 18414642
- PMCID: PMC2291010
- DOI: 10.1289/ehp.10911
Personal and ambient air pollution exposures and lung function decrements in children with asthma
Abstract
Background: Epidemiologic studies have shown associations between asthma outcomes and outdoor air pollutants such as nitrogen dioxide and particulate matter mass < 2.5 microm in diameter (PM(2.5)). Independent effects of specific pollutants have been difficult to detect because most studies have relied on highly correlated central-site measurements.
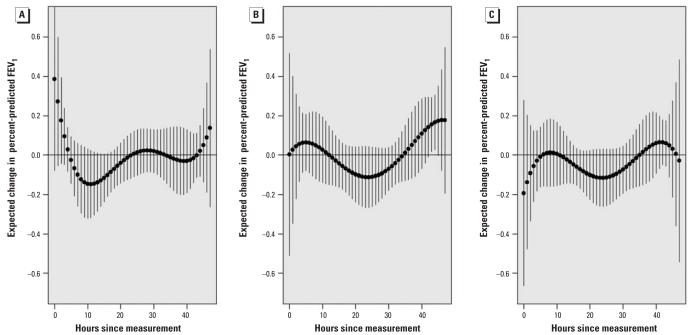
Objectives: This study was designed to evaluate the relationship of daily changes in percent-predicted forced expiratory volume in 1 sec (FEV(1)) with personal and ambient air pollutant exposures.
Methods: For 10 days each, we followed 53 subjects with asthma who were 9-18 years of age and living in the Los Angeles, California, air basin. Subjects self-administered home spirometry in themorning, afternoon, and evening. We measured personal hourly PM(2.5) mass, 24-hr PM(2.5) elemental and organic carbon (EC-OC), and 24-hr NO(2), and the same 24-hr average outdoor central-site(ambient) exposures. We analyzed data with transitional mixed models controlling for personal temperature and humidity, and as-needed beta(2)-agonist inhaler use.
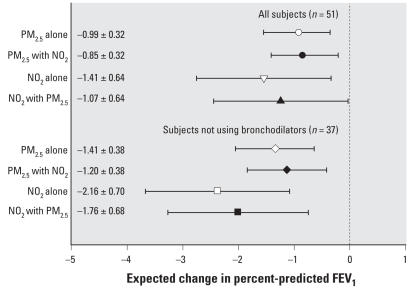
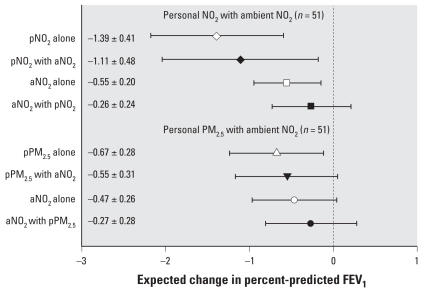
Results: FEV(1) decrements were significantly associated with increasing hourly peak and daily average personal PM(2.5), but not ambient PM(2.5). Personal NO(2) was also inversely associated with FEV(1). Ambient NO(2) was more weakly associated. We found stronger associations among 37 subjects not taking controller bronchodilators as follows: Personal EC-OC was inversely associated with morning FEV(1); for an interquartile increase of 71 microg/m(3) 1-hr maximum personal PM(2.5), overall percent-predicted FEV(1) decreased by 1.32% [95% confidence interval (CI), -2.00 to -0.65%]; and for an interquartile increase of 16.8 ppb 2-day average personal NO(2), overall percent-predicted FEV(1) decreased by 2.45% (95% CI, -3.57 to -1.33%). Associations of both personal PM(2.5) and NO(2) with FEV(1) remained when co-regressed, and both confounded ambient NO(2).
Conclusions: Independent pollutant associations with lung function might be missed using ambient data alone. Different sets of causal components are suggested by independence of FEV(1) associations with personal PM(2.5) mass from associations with personal NO(2).
Keywords: asthma; epidemiology; forced expiratory flow rates; longitudinal data analysis; nitrogen dioxide; panel study; particulate air pollution.
Figures
References
-
- Aekplakorn W, Loomis D, Vichit-Vadakan N, Shy C, Wongtim S, Vitayanon P. Acute effect of sulphur dioxide from a power plant on pulmonary function of children, Thailand. Int J Epidemiol. 2003;32:854–861. - PubMed
-
- Biswas S, Ntziachristos L, Moore KF, Sioutas C. Particle volatility in the vicinity of a freeway with heavy-duty diesel traffic. Atmospheric Environment. 2007;41:3479–3493. - PubMed
-
- Chakrabarti B, Fine PM, Delfino RJ, Sioutas C. Performance evaluation of the active-flow personal DataRAM PM2.5 mass monitor (Thermo Anderson pDR-1200) designed for continuous personal exposure measurements. Atmos Environ. 2004;38:3329–3340.
Publication types
MeSH terms
Grants and funding
LinkOut - more resources
Full Text Sources
Other Literature Sources
Medical
