. 2008 Apr 16;3(4):e1953.
doi: 10.1371/journal.pone.0001953.

Analyses of in vivo interaction and mobility of two spliceosomal proteins using FRAP and BiFC

Affiliations

Analyses of in vivo interaction and mobility of two spliceosomal proteins using FRAP and BiFC

Gul Shad Ali et al. PLoS One. .

Abstract

U1-70K, a U1 snRNP-specific protein, and serine/arginine-rich (SR) proteins are components of the spliceosome and play critical roles in both constitutive and alternative pre-mRNA splicing. However, the mobility properties of U1-70K, its in vivo interaction with SR proteins, and the mobility of the U1-70K-SR protein complex have not been studied in any system. Here, we studied the in vivo interaction of U1-70K with an SR protein (SR45) and the mobility of the U1-70K/SR protein complex using bimolecular fluorescence complementation (BiFC) and fluorescence recovery after photobleaching (FRAP). Our results show that U1-70K exchanges between speckles and the nucleoplasmic pool very rapidly and that this exchange is sensitive to ongoing transcription and phosphorylation. BiFC analyses showed that U1-70K and SR45 interacted primarily in speckles and that this interaction is mediated by the RS1 or RS2 domain of SR45. FRAP analyses showed considerably slower recovery of the SR45/U1-70K complex than either protein alone indicating that SR45/U1-70K complexes remain in the speckles for a longer duration. Furthermore, FRAP analyses with SR45/U1-70K complex in the presence of inhibitors of phosphorylation did not reveal any significant change compared to control cells, suggesting that the mobility of the complex is not affected by the status of protein phosphorylation. These results indicate that U1-70K, like SR splicing factors, moves rapidly in the nucleus ensuring its availability at various sites of splicing. Furthermore, although it appears that U1-70K moves by diffusion its mobility is regulated by phosphorylation and transcription.


Conflict of interest statement

Competing Interests: The authors have declared that no competing interests exist.

Figures

Figure 1
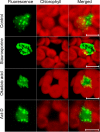
Figure 1. Subnuclear distribution of U1-70K is affected by protein phosphorylation but not by transcription and dephosphorylation.
Confocal images of Arabidopsis protoplasts expressing GFP-U1-70K that were either left untreated (control) or treated with staurosporine, okadaic or actinomycin-D (Act-D) for 2 hours. Inhibition of phosphorylation redistributes U1-70K to larger speckles (Staurosporine). Shown are representative images presented as projections of 10 z-stack slices each 0.5 µm apart of at least 50 examined protoplasts. Bar = 5 µm.
Figure 2
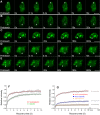
Figure 2. Mobility of GFP-U1-70K depends on transcription and protein phosphorylation.
A nucleoplasmic area or a speckle indicated by an arrow was bleached with a high intensity 488 nm laser and photographed immediately and at regular intervals of ∼100 milliseconds after bleaching. Successive images taken after bleaching illustrate the level of return of fluorescence to bleached areas. (A and B) Fluorescence recovery after photobleaching (FRAP) images of control cells demonstrate that the GFP-U1-70K recovers fully within less than 10 seconds (A, nucleoplasm) or 20 seconds (B, speckle) indicating that U1-70K turns over very rapidly in speckles and nucleoplasm. (C) FRAP images of a representative protoplast treated with staurosporine show very little or no recovery. (D and E) FRAP images of a representative protoplast treated with actinomycin-D show a control level mobility in the nucleoplasm (D) and significantly reduced mobility in a speckle (E). Bar = 5 µm. (F) Quantification of FRAP data in speckles and the nucleoplasm reveals that U1-70K displays slower mobility in the speckles than in the nucleoplasm. Each data point is the average of 7 to 11 nuclei. Error bars are SEMs. (G) Quantification of FRAP data of U1-70K in nuclei treated with actinomycin-D or staurosporine demonstrates that the mobility of U1-70K is reduced by inhibition of transcription or phosphorylation. Each data point is the average of 5–10 nuclei. Error bars are SEMs.
Figure 3
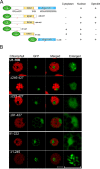
Figure 3. Speckle targeting signals in U1-70K are located in two different domains.
(A) Constructs of full-length and deletion mutants of U1-70K tagged with GFP. Numbers after “Δ” are the deleted amino acids in U1-70K. Stars indicate the location of putative nuclear localization signals (NLS; amino acid sequences are shown below the stars). Table on the right shows the subcellular and subnuclear localization of the U1-70K deletion mutants. (+, present; −, absent). RRM, RNA recognition motif; Arg-rich, arginine-rich region; (B) Confocal images of Arabidopsis protoplasts expressing full-length U1-70K or a deletion mutant as indicated on each panel. Images in the right most column show a zoomed-in nuclear region of images shown under the GFP column. These results show that U1-70K has two independent nuclear- and speckle-targeting signals located in the N-terminal region up to the RRM domain and in the C-terminal arginine-rich region. Bars = 5 µm.
Figure 4
Figure 4. Co-localization of the Arabidopsis U1-70K and SR45.
Confocal images of an Arabidopsis protoplast expressing GFP-SR45 fusion and RFP-U1-70K fusion. The merged image reveals extensive co-localization of these proteins. Chlorophyll autofluorescence is shown in blue. Bars = 5 µm.
Figure 5
Figure 5. Bimolecular fluorescence complementation (BiFC)-based mapping of SR45 domains interacting with U1-70K.
(A) BiFC vectors harboring U1-70K and a series of deletion mutants of SR45 were made by fusing full-length U1-70K to the N-terminal YFP fragment, YFPN (amino acids 1–155) and of SR45 full-length and deletion mutants to the C-terminal YFP fragment YFPC (amino acids 156–239) as described in Materials and Methods. Numbers after “Δ” show the deleted SR45 amino acids. C-myc, c-myc peptide; HA, hemagglutinin peptide. RS1 and RS2, arginine/serine-rich domain 1 and 2; RRM, RNA recognition motif. (B) BiFC images of Arabidopsis protoplasts co-transfected with U1-70K-YFPN and a full-length or deletion mutant of SR45-YFPC as indicated on each panel show that SR45 interacts with U1-70K through its RS1 or RS2 domain. Bar = 5 µm. (C) Western blot analyses show protein expression levels of U1-70K-YFPN and of full-length and deletion mutants of SR45 fused to YFPC. The U1-70K-YFPN was detected with an anti-c-myc-HRP (upper panel) and SR45 and its deletion mutants fused to YFPC were detected with an anti-HA-HRP antibody (lower panel).
Figure 6
Figure 6. Effect of phosphorylation and transcription on the subnuclear localization pattern of SR45/U1-70K BiFC complexes.
Arabidopsis protoplasts co-expressing a U1-70K-YFPN and an SR45 full length and deletion mutants as indicated on each panel were treated with staurosporine or okadaic acid. Images show staurosporine re-organized the SR45/U1-70K BiFC complexes into irregular shaped speckles. Bar = 5 µm.
Figure 7
Figure 7. FRAP analyses of SR45/U1-70K BiFC complex.
(A and B) An area indicated by an arrow in a protoplast co-expressing SR45-YFPC and U1-70K-YFPN was bleached with a high intensity 488 laser and imaged at regular intervals for up to 400 seconds. Shown are images immediately before bleach (pre-bleach) and at selected time-points after bleaching. Control is an untreated protoplast; stau. is a protoplast treated with staurosporine for two hours. Bar = 5 µm. (C and D) Quantification of FRAP of SR45/U1-70K BiFC complexes in protoplasts. The data suggest that SR45/U1-70K complex moves very slowly in the cells and this movement is not affected by phosphorylation. For discussion, see text. Each data point is the average of 7 nuclei. Error bars are SEMs.

References

    1. Reddy AS. Alternative splicing of pre-messenger RNAs in plants in the genomic era. Annu Rev Plant Biol. 2007;58:267–294. - PubMed
    1. Reddy ASN. Nuclear Pre-mRNA Splicing in Plants. Critical Reviews in Plant Sciences. 2001;20:523–571.
    1. Graveley BR. Alternative splicing: increasing diversity in the proteomic world. Trends Genet. 2001;17:100–107. - PubMed
    1. Ast G. How did alternative splicing evolve? Nat Rev Genet. 2004;5:773–782. - PubMed
    1. Maniatis T, Tasic B. Alternative pre-mRNA splicing and proteome expansion in metazoans. Nature. 2002;418:236–243. - PubMed

Publication types

MeSH terms

Substances