. 2008 Apr 16;3(4):e2004.
doi: 10.1371/journal.pone.0002004.

Cyclic and sleep-like spontaneous alternations of brain state under urethane anaesthesia

Affiliations

Cyclic and sleep-like spontaneous alternations of brain state under urethane anaesthesia

Elizabeth A Clement et al. PLoS One. .

Abstract

Background: Although the induction of behavioural unconsciousness during sleep and general anaesthesia has been shown to involve overlapping brain mechanisms, sleep involves cyclic fluctuations between different brain states known as active (paradoxical or rapid eye movement: REM) and quiet (slow-wave or non-REM: nREM) stages whereas commonly used general anaesthetics induce a unitary slow-wave brain state.

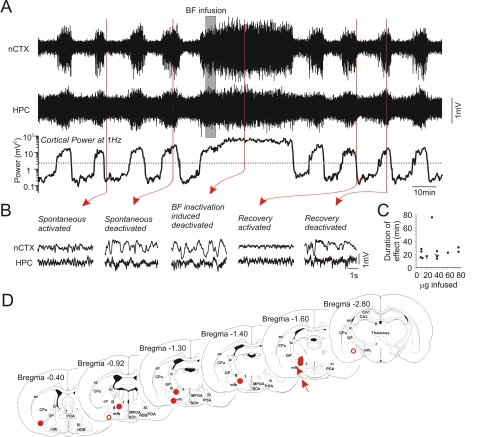
Methodology/principal findings: Long-duration, multi-site forebrain field recordings were performed in urethane-anaesthetized rats. A spontaneous and rhythmic alternation of brain state between activated and deactivated electroencephalographic (EEG) patterns was observed. Individual states and their transitions resembled the REM/nREM cycle of natural sleep in their EEG components, evolution, and time frame ( approximately 11 minute period). Other physiological variables such as muscular tone, respiration rate, and cardiac frequency also covaried with forebrain state in a manner identical to sleep. The brain mechanisms of state alternations under urethane also closely overlapped those of natural sleep in their sensitivity to cholinergic pharmacological agents and dependence upon activity in the basal forebrain nuclei that are the major source of forebrain acetylcholine. Lastly, stimulation of brainstem regions thought to pace state alternations in sleep transiently disrupted state alternations under urethane.

Conclusions/significance: Our results suggest that urethane promotes a condition of behavioural unconsciousness that closely mimics the full spectrum of natural sleep. The use of urethane anaesthesia as a model system will facilitate mechanistic studies into sleep-like brain states and their alternations. In addition, it could also be exploited as a tool for the discovery of new molecular targets that are designed to promote sleep without compromising state alternations.


Conflict of interest statement

Competing Interests: The authors have declared that no competing interests exist.

Figures

Figure 1
Figure 1. Urethane anaesthetized animals displayed spontaneous and cyclic alternations of brain state.
A) Spectra and raw EEG traces of different spontaneous states under urethane. During the activated state, the nCTX showed low voltage fast activity and the HPC showed prominent theta at ∼4 Hz. During the transition state, there was an increase in overall power with a shift to lower frequencies at both sites; raw EEG traces showed irregular and moderately high amplitude activity. During the deactivated state, there was an even more prominent shift to low (∼1 Hz) frequencies with a further increase in overall power and raw EEG traces displaying prominent rhythmic high amplitude slow activity. B) Continuous EEG traces of a spontaneous transition from activated to deactivated patterns. Positions from where the expanded traces in A were taken are shown. The transition between activated and deactivated patterns was marked by a gradual increase in the amplitude of the signals whereas the transition between deactivated and activated patterns was more abrupt. C), Continuous EEG traces over an even longer time scale demonstrated a regular and cyclic alternation of state as observed by the fluctuations in amplitude. The position from where traces in B were taken are shown. D) A spectrographic representation of the neocortical trace shown in C. The most prominent fluctuation of power was centered at a frequency of circa 1 Hz. E) Plot of power at 1 Hz from the spectrograph in D. The power values showed a cyclic fluctuation in amplitude continuing over the entire time of recording with an average period of ∼9 minutes. F) Autocorrelation of power values from the experiment shown in (E) that showed a prominent rhythmic fluctuation at a similar period (9 min). G) Scatter plot of alternation period across time. The period length for the experiment illustrated remained stable as shown by the linear fit with a slope value not significantly different from zero (p = 0.46). H) The left panel shows regression lines for cycle periods across time for all experiments having 6 or more cycles. Different experiments are represented by different colored lines and demonstrate a general lack of variation within, but some variation across, animals. Thirty eight of the forty one animals displayed here showed no significant regression at a p level of 0.05. The right panel is a scatter plot of the average periods for each experiment (equivalent colors to the right panel) and the overall average (10.3±0.4 min) across all experiments.
Figure 2
Figure 2. The rhythmicity and periodicity of state alternations under urethane were not affected by moderate increases in anaesthetic dosage.
A) Long duration raw cortical EEG traces demonstrating the electrographic effects of a moderate increase in the depth of urethane anaesthesia. Although the overall amplitude of the signal increased following the supplemental dose, state alternations (apparent as rhythmic changes in signal amplitude) were still observed. B) Spectrographic power at 1 Hz for the traces shown in A. Following the supplemental dose, power continued to fluctuate at a similar periodicity although there was an increase in the overall power in addition to the time spent in the deactivated state (and consequently a decrease in the time spent in the activated state). C) Autocorrelation of power values in B demonstrating similar rhythmicity before and after supplemental urethane administration. D) Individual (paired for animal across conditions by symbol and line) and overall averages demonstrating the consistency of alternation period duration before and after the supplemental doses of urethane across all experiments. Neither the individual nor the overall averages were significantly different.
Figure 3
Figure 3. Anaesthetic level was comparable across state alternations.
A) Individual (paired for animals across states by symbol) and overall averages of withdrawal latency across activated and deactivated states in response to a ramped infrared beam applied to the tail or hindpaw. Withdrawal latencies were comparable across states and neither the individual nor overall averages were significantly different.
Figure 4
Figure 4. Raw and spectral characteristics of forebrain EEG during activated and deactivated states were similar across during natural sleep and urethane anaesthesia.
A) Expanded neocortical and hippocampal EEG traces across natural sleep and urethane anaesthesia in the same animal showing examples of activated and deactivated patterns in both situations. Regardless of condition, activated and deactivated patterns were highly similar. B) Spectra of cortical and hippocampal EEG traces overlaid across conditions for the same electrographic patterns. Although the peak frequency of hippocampal theta power during REM was at a higher frequency (∼7 Hz) than during the activated state under urethane anaesthesia (∼4 Hz), all other spectra across conditions appear highly similar. Scatter plot of C) peak frequencies and D) power (right panel) for neocortical and hippocampal signals during the activated and deactivated state for each animal. Except for the peak frequency of hippocampal signals during activated patterns, there were no significant differences across natural sleep and urethane anaesthesia.
Figure 5
Figure 5. Transition phase between activated and deactivated patterns was characterized by cortical spindling across both natural sleep and urethane anaesthesia.
A) An expanded example of a cortical spindle oscillation recorded during natural sleep (left) and a similar pattern recorded at the same electrode during the transition phase under urethane anaesthesia (right). B) Superimposed spectral plots of cortical EEG taken during activated, transition and deactivated states in a urethane-anaesthetized animal. Note the spectral peak in the transition spectra centered at ∼8 Hz (spindle frequency). C) Superimposed spectrographic power at low (0 to 2 Hz: black) and spindle (7 to 10 Hz: red) frequencies (top panel), and the simultaneous occurrence and duration of spindles across the evolution of all state alternations for one full experiment (bottom panel). Note the augmented presence of spindling activity at the transition points between activated and deactivated patterns. D) Average (across all experiments) of the cross correlation function between 1 Hz and spindle (7–9 Hz) spectrographic power (n = 5; standardized cycle in degrees). The temporal relationship of spindling to slow oscillatory activity at 1 Hz patterns showed a consistent lag of approximately half a period length (∼180 degrees).
Figure 6
Figure 6. The timing of cyclic EEG state alternations was highly similar across naturally sleeping and urethane-anaesthetized conditions.
A) Long-duration EEG traces during a continuous natural sleep episode (left panel) and subsequently from the same animal under urethane anaesthesia (right panel). Regular fluctuations between REM and nREM sleep stages were highly comparable in their timing to the state alternations later observed under urethane. Plotted on the same time scale underneath the raw traces is the respective spectrographic power at 1 Hz extracted from the cortical signals. These fluctuations demonstrated a similar rhythmicity across both conditions. B) Scatterplot representing period lengths of alternations for all animals under both naturally sleeping and urethane anaesthetized conditions. There was a remarkable similarity in the distribution and average length of alternations for each animal as well as for the overall average for natural sleeping and urethane anaesthetized conditions.
Figure 7
Figure 7. Physiological correlates of EEG state changes were similar across naturally sleeping and urethane-anaesthetized conditions.
A) Simultaneous recordings of hippocampal field activity and neck EMG in naturally sleeping (left panel) and urethane anaesthetized (right panel) conditions in the same animal. Declines in EMG tone with transitions from nREM to REM sleep were also apparent under urethane anaesthesia with transitions from deactivated to activated EEG patterns. B) The average percentage loss of EMG amplitude across these transitions was consistent and significantly different across both natural sleep and urethane anaesthesia in the same animals. C) Simultaneous extraction of cortical spectrographic power at 1 Hz (top panel), heart rate (middle panel) and respiration rate (lower panel) demonstrating concomitant fluctuations. Increases in both heart and respiration rates appeared during the lowest EEG power readings (i.e. the activated state). As well, during the activated state, the peak frequency of respiratory cycle tended to show greater variation. D) Fluctuations in heart (top) and respiration rates (bottom) were rhythmically correlated with state changes as shown in the cross correlation of these variables to cortical power at 1 Hz. E) Summary data across experiments showing significant increases in both heart (top) and respiration rates (bottom) when comparing the activated to the deactivated state.
Figure 8
Figure 8. State alternations were dependent upon central muscarinic neurotransmission.
A) Long duration cortical EEG traces in addition to spectrographic cortical power at 1 Hz demonstrating the effects of agonism and subsequent antagonism of muscarinic receptor mediated transmission. Following an i.p. injection of oxotremorine (4.0 mg/kg) spontaneous alternations between activated and deactivated states were abolished in favor of the activated state. This induced activated state was abolished in favor of the deactivated state with a subsequent i.p. injection of atropine sulfate (ATSO4: 50 mg/kg). B) Expansions of EEG traces from neocortical sites show the similarity of activated and deactivated patterns induced by cholinergic agonism and antagonism, respectively. C) A scatter plots demonstrating the duration of the oxotremorine effect as a function of dosage. The effects of oxotremorine were longer than those of physostigmine (Figure 6C). As in Figure 6, the effects of atropine showed no reversal.
Figure 9
Figure 9. Monoaminergic depletion affected neither the activated state nor the alternations between states under urethane anaesthesia.
A) Continuous hippocampal EEG traces and spectrographic power at theta frequencies under urethane anaesthesia following reserpine (5 mg/kg) pretreatment. Alternations between states were obvious as fluctuations in the amplitude of the raw EEG in addition to the spectrographic theta power (5 Hz). A further supplemental i.p. administration of reserpine (5 mg/kg) was without effect upon either the activated state or the alternations between states. However, a subsequent i.p. injection of atropine (ATSO4: 50 mg/kg) completely abolished the activated state and subsequent alternations between state. Hippocampal B) EEG expansions and C) spectra from before and after reserpine supplement demonstrating intact theta activity in both cases. D) Scatterplots of peak power and frequencies for activated states pre and post reserpine supplement. There were no significant differences between pre and post supplement groups. E) Scatterplots of period lengths pre and post reserpine supplements demonstrating that alternations and rhythmicity were not affected by reserpine.
Figure 10
Figure 10. Local pharmacological inactivation of the basal forebrain region reversibly induces a deactivated state and temporarily abolishes state alternations.
A) Continuous long duration cortical and hippocampal EEG traces together with spectrographic cortical power at 1 Hz during an infusion of lidocaine in the basal forebrain (BF). Spontaneous state alternations were temporarily abolished in favor of a continuous activated state following inactivation of the BF. B) Expanded EEG traces from neocortical and hippocampal sites prior and following the infusion. Deactivated patterns were elicited during inactivation of the BF and these effects washed out with time. C) Duration of evoked deactivated activity as a function of the amount of lidocaine infused in the BF. D). Histological representation of infusion sites. Open circles indicate ineffective sites. Site marked with arrow and triangle denotes experiment shown in A and B. Abbreviations: B: basal nucleus, CPu: caudate putamen, ec: external capsule, f: fornix, GP: globus pallidus, HDB: horizontal limb of the diagonal band of Broca, ic: internal capsule, mfb: medial forebrain bundle, MPOA: medial preoptic area, POA: preoptic area, SCh: suprachiasmatic nucleus, SI: substantia innominata.
Figure 11
Figure 11. Stimulation trains applied to the pedunculo-pontine tegmentum temporarily abolished alternations of forebrain state.
A) Continuous cortical and hippocampal EEG traces and the spectrographic cortical power at 1 Hz demonstrating the effects of stimulation of the pedunculo-pontine tegmental (PPT) region. Subsequent to a series of moderate stimulation trains, which were each effective in promoting an activated forebrain EEG during application, there was a transient suppression of forebrain state alternations. B) Expanded EEG traces from neocortical and hippocampal sites demonstrate that activated patterns were elicited via stimulation and that deactivated patterns follow a stimulation train. C) Scatterplot and linear fit of frequency as a function of the stimulation intensity in the PPT showing a significant (p<0.01) relationship between stimulation intensity and the peak frequency of theta activity recorded in the hippocampus. The frequency was normalized across experiments to the maximal frequency of theta elicited in each. D) Summary of histological findings for the site of stimulation across experiments. Abbreviations: ll: lateral lemniscus, PAG: periaqueductal gray, PPT: pedunculo pontine tegmental nucleus, rs: rubrospinal tract, xscp: decussation of the superior cerebellar peduncle.

References

    1. Rechtschaffen A, Bergmann BM, Everson CA, Kushida CA, Gilliland MA. Sleep deprivation in the rat: X. Integration and discussion of the findings. 1989. Sleep. 2002;25:68–87. - PubMed
    1. Rechtschaffen A, Bergmann BM. Sleep deprivation in the rat: an update of the 1989 paper. Sleep. 2002;25:18–24. - PubMed
    1. Ocampo_Garces A, Molina E, Rodriguez A, Vivaldi EA. Homeostasis of REM sleep after total and selective sleep deprivation in the rat. J Neurophysiol. 2000;84:2699–2702. - PubMed
    1. Rechtschaffen A, Bergmann BM, Gilliland MA, Bauer K. Effects of method, duration, and sleep stage on rebounds from sleep deprivation in the rat. Sleep. 1999;22:11–31. - PubMed
    1. Ferrara M, De_Gennaro L, Bertini M. Selective slow-wave sleep (SWS) deprivation and SWS rebound: do we need a fixed SWS amount per night? Sleep Res Online. 1999;2:15–19. - PubMed

Publication types