. 2008 Dec;57(12):1795-805.
doi: 10.1007/s00262-008-0507-4. Epub 2008 Apr 15.

Selective accumulation of differentiated FOXP3(+) CD4 (+) T cells in metastatic tumor lesions from melanoma patients compared to peripheral blood

Affiliations

Selective accumulation of differentiated FOXP3(+) CD4 (+) T cells in metastatic tumor lesions from melanoma patients compared to peripheral blood

Camilla Jandus et al. Cancer Immunol Immunother. 2008 Dec.

Abstract

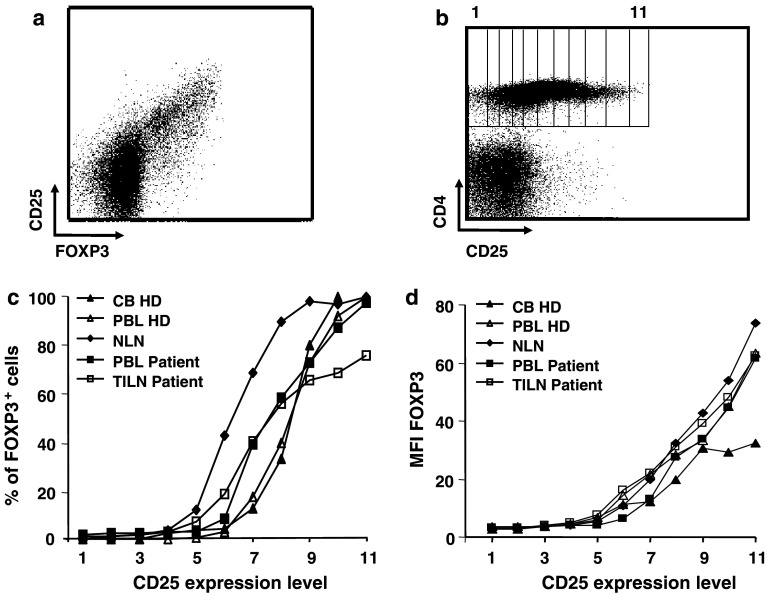
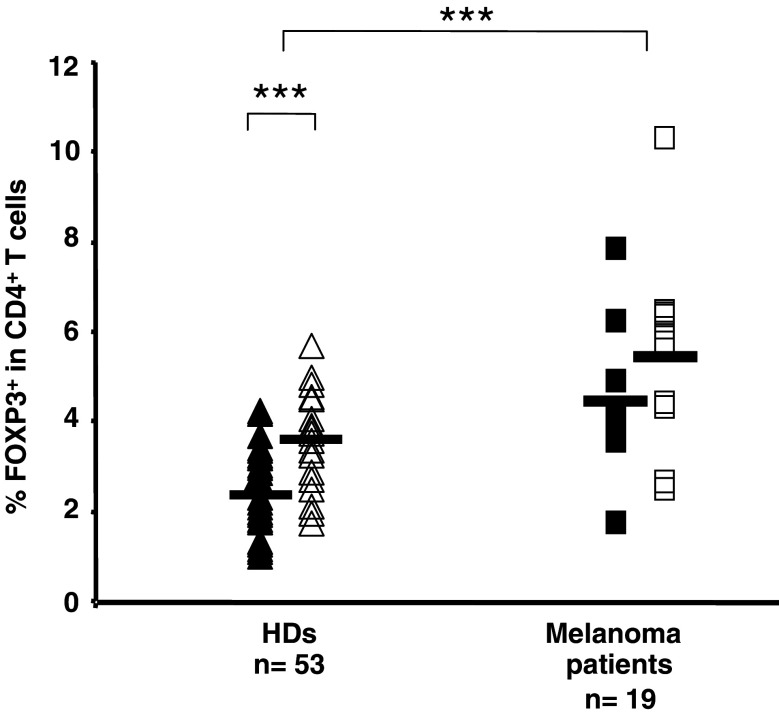
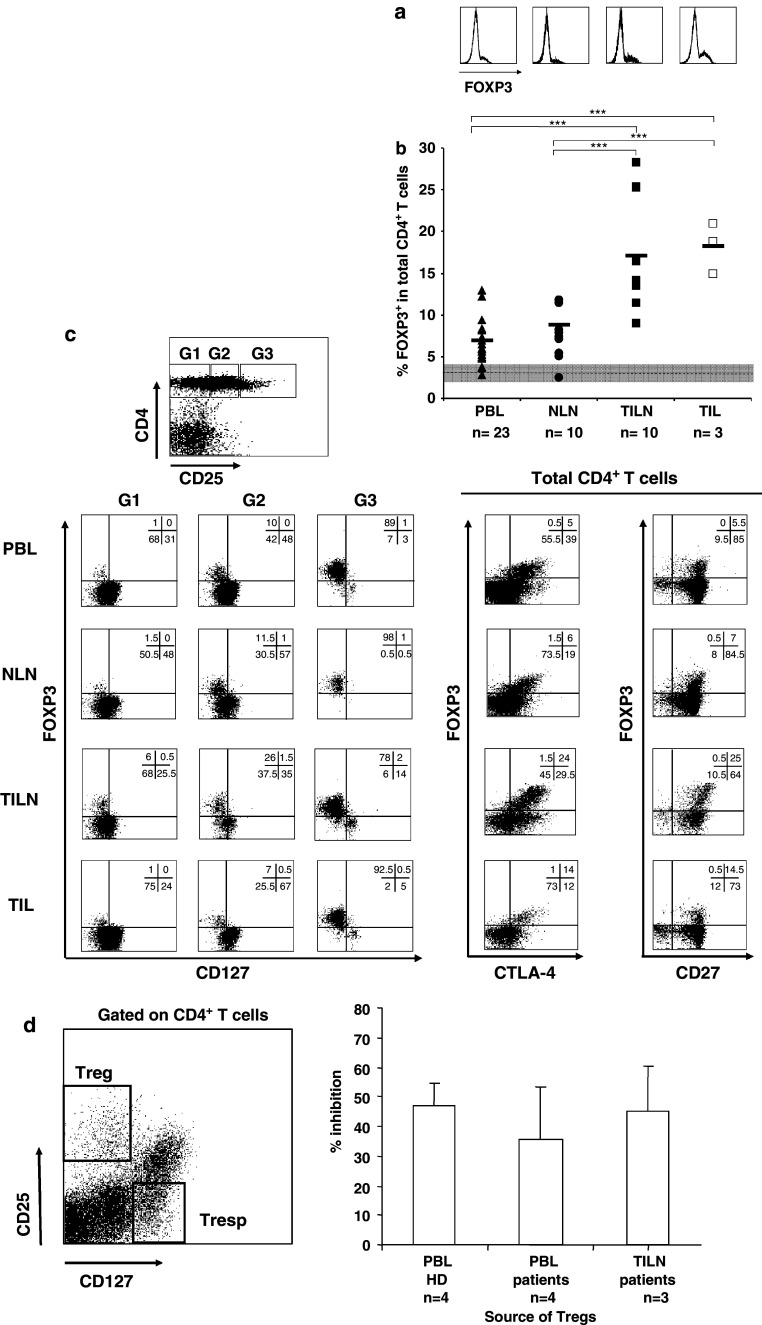
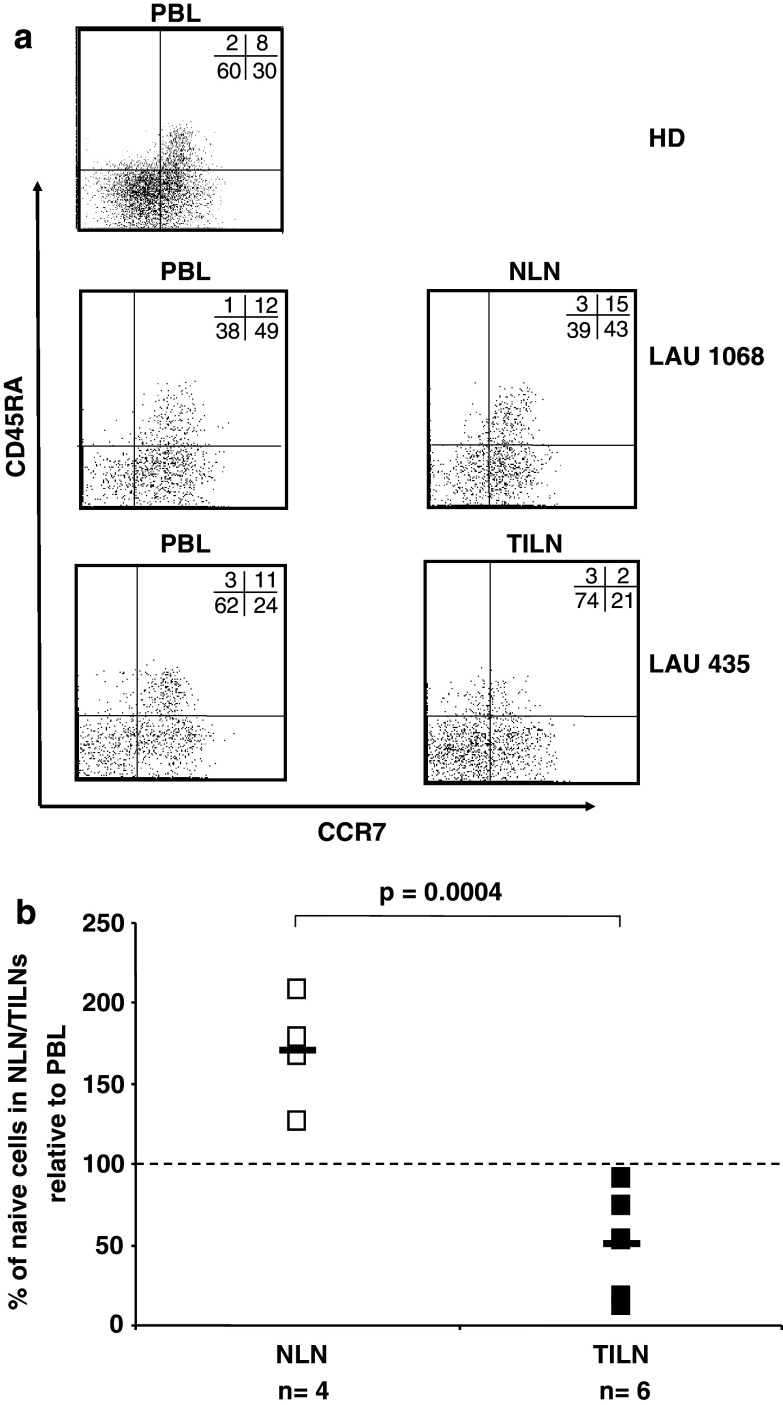
Precise identification of regulatory T cells is crucial in the understanding of their role in human cancers. Here, we analyzed the frequency and phenotype of regulatory T cells (Tregs), in both healthy donors and melanoma patients, based on the expression of the transcription factor FOXP3, which, to date, is the most reliable marker for Tregs, at least in mice. We observed that FOXP3 expression is not confined to human CD25(+/high) CD4(+) T cells, and that these cells are not homogenously FOXP3(+). The circulating relative levels of FOXP3(+) CD4(+) T cells may fluctuate close to 2-fold over a short period of observation and are significantly higher in women than in men. Further, we showed that FOXP3(+) CD4(+) T cells are over-represented in peripheral blood of melanoma patients, as compared to healthy donors, and that they are even more enriched in tumor-infiltrated lymph nodes and at tumor sites, but not in normal lymph nodes. Interestingly, in melanoma patients, a significantly higher proportion of functional, antigen-experienced FOXP3(+) CD4(+) T was observed at tumor sites, compared to peripheral blood. Together, our data suggest that local accumulation and differentiation of Tregs is, at least in part, tumor-driven, and illustrate a reliable combination of markers for their monitoring in various clinical settings.


Figures

Fig. 1
Fig. 1
Correlation between FOXP3 and CD25 expression on different CD4+ human T cell subsets. Human lymphocytes purified from cord blood (CB), peripheral blood (PBL), normal lymph nodes (NLN), or tumor-infiltrated lymph nodes (TILN) were stained using a combination of anti-CD4, anti-CD25, and anti-FOXP3 antibodies. a Representative dot plot for CD25 and FOXP3 staining is shown. Dot plot is gated on CD4+ cells. b Rectangular gates from 1 to 11 were drawn on CD4+ T cells according to increasing expression of the CD25 antigen, as labeled with a PE-conjugated antibody. c Percentages of FOXP3 positive cells were calculated for CD4+ T cells in each gate using CellQuest software. Representative examples for HDs and patients are shown. d Mean fluorescence intensity (MFI) of FOXP3 is shown for CD4+ T cells in each gate. Representative examples for HDs and patients are shown
Fig. 2
Fig. 2
Longitudinal study of FOXP3 expression on human CD4+ T cells in healthy donor (HD) blood. a Human lymphocytes purified from peripheral blood of HDs, three men (closed symbols) and three women (open symbols), were stained using a combination of anti-CD4 and anti-FOXP3 antibodies, in triplicates. Blood withdrawal was performed over a period of 13 months, on days 0, 2, 4, 11, 25, 53, 365, and 395. All the samples, from all time points, were frozen on the day of blood withdrawal, using the same standard operating procedure, and the staining was performed, in triplicates, on the same day for all the samples collected between days 0 and 4, between days 11 and 53, and between days 365 and 395 in order to reduce possible variations due to processing/staining. Mean percentages of FOXP3+ T cells in total CD4+ T cells, with SE bars for each time point measured, are shown. b Rectangular gates (G1, G2, and G3) were drawn on CD4+ T cells according to increasing expression of the CD25 antigen, and expression of FOXP3 and CD127 in each gate is shown in representative dot plots (left dot plots). Expression of FOXP3 and CTLA-4, as well as FOXP3 and CD27, is shown in total CD4+ T cells (right dot plots). Numbers represent percentages of cells in each quadrant
Fig. 3
Fig. 3
FOXP3 expression on human peripheral blood CD4+ T cells from HDs and melanoma patients, segregated by gender. Lymphocytes were purified from peripheral blood of HDs (n = 53) and melanoma patients (n = 19) and percentages of FOXP3+ in total CD4+ T cells were measured by flow cytometry. Closed symbols represent values in men, open symbols in women. Black lines represent mean percentage values. ***P value <0.001
Fig. 4
Fig. 4
FOXP3 expression on CD4+ T cells in melanoma patient tissues. Lymphocytes were purified from PB, NLNs, TILNs, and TILs from melanoma patients (n = 23). Percentages of FOXP3+ in total CD4+ T cells were measured by flow cytometry. a Representative histograms for FOXP3 staining in gated CD4+ T cells are shown for each tissue. b Black lines represent mean percentage values in the different body compartments. Dashed line represents the mean value of FOXP3+ in total CD4+ T cells in HDs (grey area stays for CV). ***P value <0.001. c Rectangular gates (G1, G2, and G3) were drawn on CD4+ T cells according to increasing expression of the CD25 antigen, and expression of FOXP3 and CD127 in each gate is shown in representative dot plots for the different tissues (left dot plots). Expression of FOXP3 and CTLA-4, as well as FOXP3 and CD27, is shown in total CD4+ T cells for the different tissues (right dot plots). Numbers represent percentages of cells in each quadrant. d Purified CD4+ CD25+ CD127 T cells and CD4+ CD25 CD127+ T cells, obtained by flow cytometry-based cell sorting from PBLs from four HDs and four melanoma patients, and from freshly prepared single cell suspensions from three metastatic lymph nodes, were cultured either alone or at 1:1 ratio under allogeneic stimulation. 3[H] thymidine was added on day 5 for the last 18 h. On the left, the gating strategy for sorting, and on the right, the mean percentages and standard deviations of inhibition of proliferation, are shown
Fig. 5
Fig. 5
Selective decrease of naive FOXP3+ CD4+ T cells in TILN of melanoma patients. Lymphocytes were purified from peripheral blood, normal lymph nodes, tumor-infiltrated lymph nodes from HDs (n = 37) and melanoma patients (n = 10). Multicolor flow cytometric analysis was performed using a combination of anti-CD4, anti-CD45RA, anti-CCR7, and anti-FOXP3 antibodies. a Representative dot plots of CCR7 and CD45RA staining on FOXP3+ CD4+ T cells in PBLs from a HD (upper panel), PBLs and NLN (middle panels), or PBLs and TILN (lower panels) of melanoma patients LAU 1068 and LAU 435, respectively. Numbers represent percentages of cells in each quadrant. b Percentages of naive cells (CD45RA+ CCR7+) in FOXP3+ CD4+ T cells in NLN or TILN of melanoma patients. The level of naive cells in FOXP3+ CD4+ T cells in autologous PBLs, are represented by 100%

References

    1. Ahmadzadeh M, Rosenberg SA. IL-2 administration increases CD4+ CD25(hi) Foxp3+ regulatory T cells in cancer patients. Blood. 2006;107:2409–2414. doi: 10.1182/blood-2005-06-2399. - DOI - PMC - PubMed
    1. Anichini A, Vegetti C, Mortarini R. The paradox of T-cell-mediated antitumor immunity in spite of poor clinical outcome in human melanoma. Cancer Immunol Immunother. 2004;53:855–864. doi: 10.1007/s00262-004-0526-8. - DOI - PMC - PubMed
    1. Annunziato F, Cosmi L, Liotta F, Lazzeri E, Manetti R, Vanini V, Romagnani P, Maggi E, Romagnani S. Phenotype, localization, and mechanism of suppression of CD4(+) CD25(+) human thymocytes. J Exp Med. 2002;196:379–387. doi: 10.1084/jem.20020110. - DOI - PMC - PubMed
    1. Appay V, Jandus C, Voelter V, Reynard S, Coupland SE, Rimoldi D, Lienard D, Guillaume P, Krieg AM, Cerottini JC, Romero P, Leyvraz S, Rufer N, Speiser DE. New generation vaccine induces effective melanoma-specific CD8+ T cells in the circulation but not in the tumor site. J Immunol. 2006;177:1670–1678. - PubMed
    1. Arruvito L, Sanz M, Banham AH, Fainboim L. Expansion of CD4+CD25+and FOXP3+ regulatory T cells during the follicular phase of the menstrual cycle: implications for human reproduction. J Immunol. 2007;178:2572–2578. - PubMed

Publication types

Substances