. 2008 Apr 15;6(4):e83.
doi: 10.1371/journal.pbio.0060083.

Gene-environment interaction in yeast gene expression

Affiliations

Gene-environment interaction in yeast gene expression

Erin N Smith et al. PLoS Biol. .

Abstract

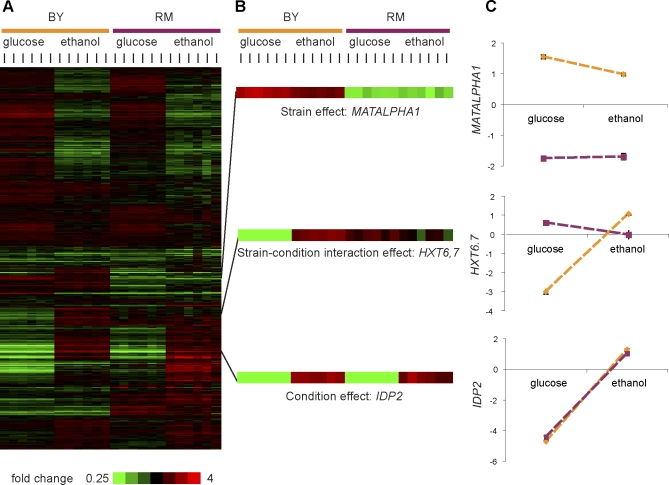
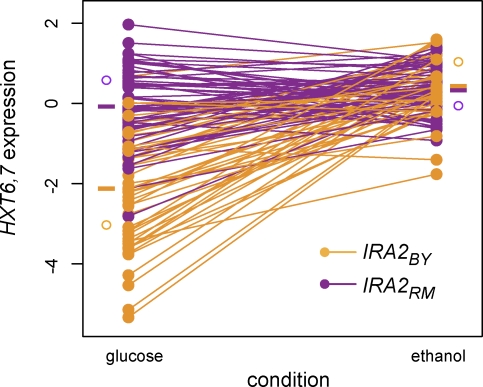
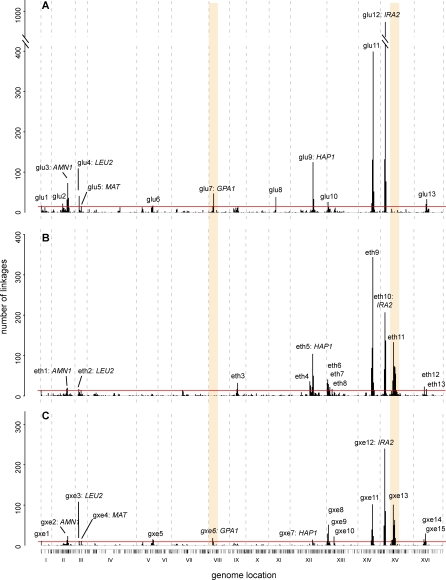
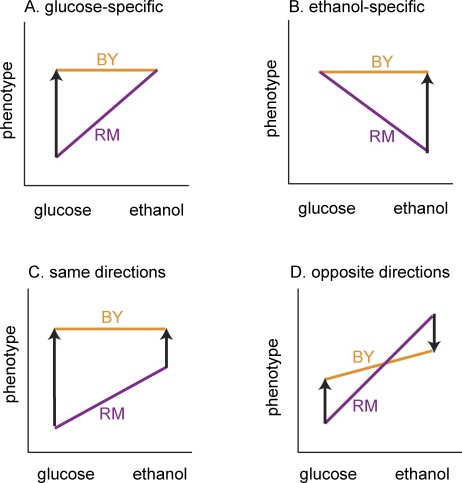
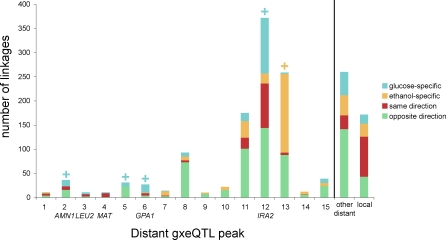
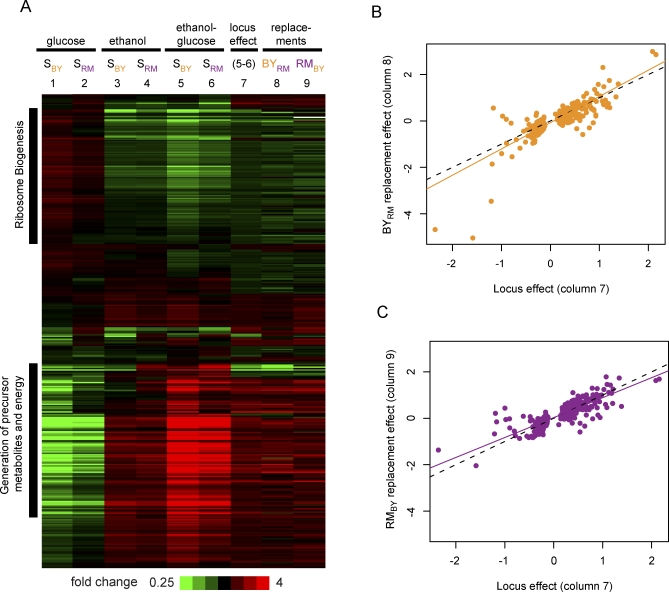
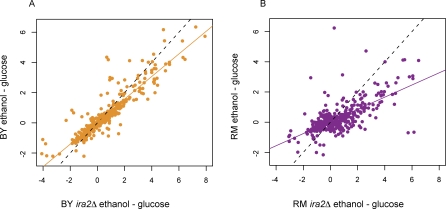
The effects of genetic variants on phenotypic traits often depend on environmental and physiological conditions, but such gene-environment interactions are poorly understood. Recently developed approaches that treat transcript abundances of thousands of genes as quantitative traits offer the opportunity to broadly characterize the architecture of gene-environment interactions. We examined the genetic and molecular basis of variation in gene expression between two yeast strains (BY and RM) grown in two different conditions (glucose and ethanol as carbon sources). We observed that most transcripts vary by strain and condition, with 2,996, 3,448, and 2,037 transcripts showing significant strain, condition, and strain-condition interaction effects, respectively. We expression profiled over 100 segregants derived from a cross between BY and RM in both growth conditions, and identified 1,555 linkages for 1,382 transcripts that show significant gene-environment interaction. At the locus level, local linkages, which usually correspond to polymorphisms in cis-regulatory elements, tend to be more stable across conditions, such that they are more likely to show the same effect or the same direction of effect across conditions. Distant linkages, which usually correspond to polymorphisms influencing trans-acting factors, are more condition-dependent, and often show effects in different directions in the two conditions. We characterized a locus that influences expression of many growth-related transcripts, and showed that the majority of the variation is explained by polymorphism in the gene IRA2. The RM allele of IRA2 appears to inhibit Ras/PKA signaling more strongly than the BY allele, and has undergone a change in selective pressure. Our results provide a broad overview of the genetic architecture of gene-environment interactions, as well as a detailed molecular example, and lead to key insights into how the effects of different classes of regulatory variants are modulated by the environment. These observations will guide the design of studies aimed at understanding the genetic basis of complex traits.


Conflict of interest statement

Competing interests. The authors have declared that no competing interests exist.

Figures

Figure 1
Figure 1. Strain, Condition, and Strain–Condition Interaction Effects in Parental Strains
Six replicates of each parental strain (BY and RM) were expression profiled in each condition (glucose and ethanol), and 4,342 transcripts with high-quality data were tested for strain, condition, and strain–condition interaction effects using two-way ANOVA. (A) Clustergram of all 24 arrays and 4,342 transcripts. Note the high reproducibility of the sets of biological replicates. (B) Three transcripts are highlighted as strong examples of effects of strain (MATALPHA1), strain–condition interaction (HXT6,7), and condition (IDP2). (C) Two-factor plots with strain indicated in color (BY = orange, and RM = purple). The average of six values is indicated by each point, with error bars indicating the standard error. When no error bars are visible, the standard error was smaller than the point used to plot the average.
Figure 2
Figure 2. Distribution of Proportion of Variance Explained in Parental Strains
The relative proportion of strain–condition interaction, strain, and condition variance is shown for all transcripts in the parental strains in which these variances add up to at least 50% of the total variance (3,219 of 4,342 transcripts; 74%). If a point is at a vertex of the triangle, the relative proportion of variance due to the labeled factor is 1, and the proportion decreases to zero along the line from the vertex to the midpoint of the opposite side. Insets show two-factor plots (reaction norms) for representative transcripts. The average for the BY strain is in orange, the average for the RM strain is in purple, and error bars indicate standard deviations. Transcript levels are log2 ratios versus the common reference.
Figure 3
Figure 3. Interaction between Condition and IRA2 Genotype in Expression of HXT6,7
HXT6,7 shows gene–environment interaction with the region containing IRA2. Phenotypes for 109 segregants are split by whether they inherited the BY allele (orange) or RM allele (purple) of the IRA2 region. For each segregant, the expression values in glucose and ethanol are plotted and connected by a line. The difference between the expression values in ethanol and glucose (or the slope across conditions) is the phenotype that is used to find loci that show gene–environment interaction. In this case, segregants that inherit the BY allele show low expression of HXT6,7 in glucose, but higher expression in ethanol. Segregants that inherit the RM allele, however, express HXT6,7 at the higher level in both glucose and ethanol. Horizontal bars to the left and right indicate the mean phenotypic values for all segregants carrying a particular allele in a condition. Open circles indicate the mean phenotypic value for the parental strains in each condition.
Figure 4
Figure 4. Expression Linkage Peaks Can Change between Conditions
For linkages in glucose (A), in ethanol (B), and gxeQTL (C), the number of distant linkages falling in 10-cM large genomic bins is plotted. On the x-axis is the genomic location of each bin, with tick marks indicating the location of individual markers and roman numerals indicating chromosome number. We identified bins with a total number of linkages that is unlikely to occur by chance (this threshold is indicated by a red line; see Materials and Methods for details). Such bins located directly adjacent to each other were collapsed to a single peak. Peaks are labeled with a number when the underlying gene is unknown and additionally by a gene name when a polymorphism in the gene has been shown to be associated with expression phenotypes that linked to the region in at least one condition. For several regions, differences between distant linkages in glucose and distant linkages in ethanol are reflected in the gxeQTL peaks. Two regions with striking effects are highlighted in peach. On chromosome 8, a peak overlapping with GPA1 is present in glucose, but absent in ethanol, and this difference is detected as gene–environment interaction. On chromosome 15, a peak with no known regulator is absent in glucose, present in ethanol (eth11), and shows gene–environment interaction (gxe13).
Figure 5
Figure 5. A Schematic of Different Types of Gene–Environment Interaction Effects
Gene–environment interaction can occur in a number of different ways. In these plots, different alleles at a locus (these could also be different strains) are indicated by solid lines colored either orange or purple. These solid lines connect the two measurements that were taken in the two conditions for ease of visualizing the difference between conditions. When different alleles show a significant difference in one of the conditions, a black arrow connects the two measurements and indicates the difference between the orange and the purple alleles. In (A) and (B), the locus shows condition specificity and only has an effect in one of the conditions. In (C) and (D), the locus shows a significant effect in both conditions. In (C), the difference between the alleles is in the same direction in the two conditions. In (D), the difference between the alleles is in the opposite direction in the two conditions.
Figure 6
Figure 6. gxeQTL Peaks Show Variation in Condition-Specific Behavior
For each gxeQTL peak, the number of linkages that are glucose specific (blue), ethanol specific (orange), active in both conditions, with the same direction of effect (red), and active in both conditions, with opposite direction of effect (green). On the right for comparison, all distant linkages that did not fall into a peak are combined into one group, and all local linkages are combined into one group. Significant results from the test for enrichment of glucose specific (blue plus [+] signs) or enrichment of ethanol specific (orange plus [+] sign) are indicated above the bars.
Figure 7
Figure 7. Polymorphism in IRA2 Contributes to Environmentally Dependent Phenotypic Variation
(A) Expression values for 370 transcripts with gxeQTL confidence intervals that overlap IRA2 are shown. Average expression values for segregants (S) carrying either allele in glucose, in ethanol, and for the difference between ethanol and glucose are shown in columns 1–6. The overall effect of the locus between conditions (locus effect) is shown in column 7, which is the difference between columns 5 and 6. The effects of the replacements are shown in column 8 and 9. The difference between conditions in each replacement was compared to the difference observed in the appropriate parental background strain (BY in column 8, and RM in column 9). The similarity of columns 8 and 9 to column 7 indicates that polymorphism in the replaced region recapitulates the effect of the locus well and shows that polymorphism in IRA2 is functionally responsible for determining how these transcripts differ between conditions among the segregants. (B) Scatterplot of the locus effect (column 7 in [A]), versus the effect of introducing IRA2-RM into the BY background (column 8 in [A]). Each point represents a transcript; orange line is the best fit by linear regression. The black dotted line indicates y = x. The slope of the regression line is 1.1 (95% CI 1.05–1.21) with a correlation of 0.84 (70% variance explained), and a permutation p-value of 0.002. (C) Scatterplot of the locus effect (column 7 in [A]), as compared to the effect of introducing IRA2-BY into the RM background (column 9 in [A]). Symbols and lines as in (B). The slope of the regression line is 0.86 (95% CI 0.80–0.92) with a correlation of 0.83 (69% variance explained), and a permutation p-value less than 0.001.
Figure 8
Figure 8. The BY Allele of IRA2 Is More Similar to a Knockout Than the RM Allele of IRA2
In order to assess the role of different alleles of IRA2, this gene was knocked out in both parental strain backgrounds. For all transcripts with gxeQTL in the region containing IRA2, we plotted the change in expression across conditions (ethanol–glucose). (A) Scatterplot of the difference for the knockout (x-axis) versus the parental strain (y-axis) in the BY background. (B) Scatterplot in the RM background. The BY ira2Δ knockout is significantly different from the parental strain (regression slope = 0.75, 95% CI = 0.71–0.78), but the RM ira2Δ knockout shows an even larger difference from the parent strain (regression slope = 0.40, 95% CI 0.35–0.45). This indicates that in the conditions studied, the RM allele of IRA2 is playing a larger role in determining how these transcripts differ between conditions.

Similar articles

Cited by

References

    1. Talmud PJ. Gene-environment interaction and its impact on coronary heart disease risk. Nutr Metab Cardiovasc Dis. 2007;17:148–152. - PubMed
    1. Caspi A, Sugden K, Moffitt TE, Taylor A, Craig IW, et al. Influence of life stress on depression: moderation by a polymorphism in the 5-HTT gene. Science. 2003;301:386–389. - PubMed
    1. Ulrich CM, Kampman E, Bigler J, Schwartz SM, Chen C, et al. Colorectal adenomas and the C677T MTHFR polymorphism: evidence for gene-environment interaction. Cancer Epidemiol Biomarkers Prev. 1999;8:659–668. - PubMed
    1. Paterson AH, Damon S, Hewitt JD, Zamir D, Rabinowitch HD, et al. Mendelian factors underlying quantitative traits in tomato: comparison across species, generations, and environments. Genetics. 1991;127:181–197. - PMC - PubMed
    1. Ungerer MC, Halldorsdottir SS, Purugganan MD, Mackay TF. Genotype-environment interactions at quantitative trait loci affecting inflorescence development in Arabidopsis thaliana. Genetics. 2003;165:353–365. - PMC - PubMed

Publication types

Substances

Associated data