Comparative Study
. 2008 Apr 16;28(16):4250-60.
doi: 10.1523/JNEUROSCI.0066-08.2008.

Alpha-synuclein alters Notch-1 expression and neurogenesis in mouse embryonic stem cells and in the hippocampus of transgenic mice

Affiliations
Comparative Study

Alpha-synuclein alters Notch-1 expression and neurogenesis in mouse embryonic stem cells and in the hippocampus of transgenic mice

Leslie Crews et al. J Neurosci. .

Abstract

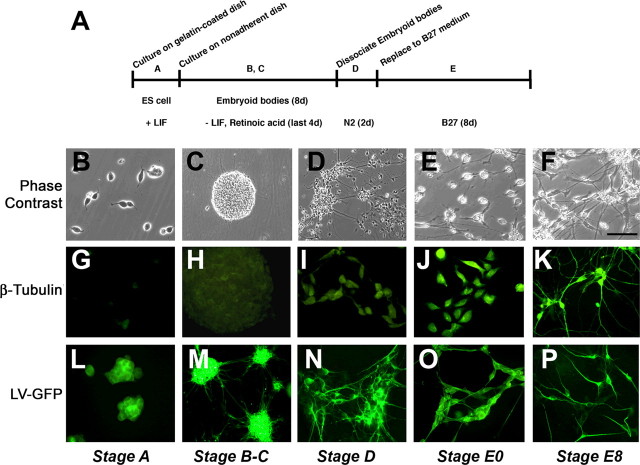
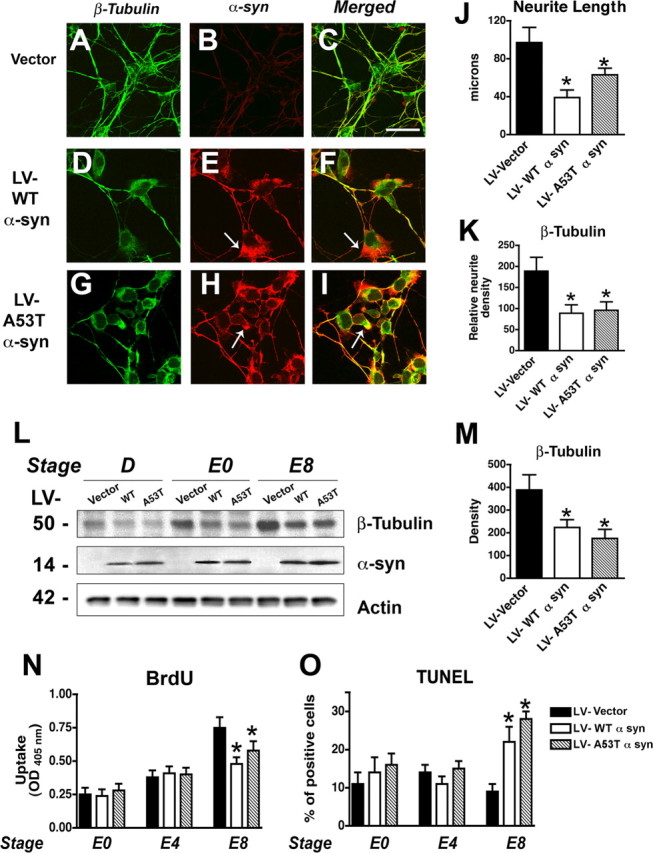
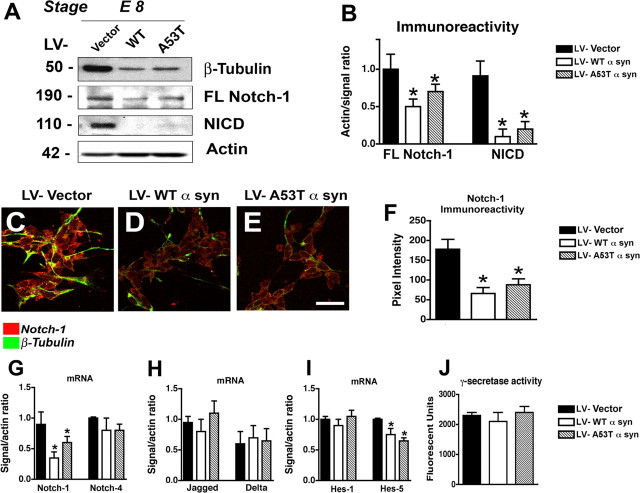
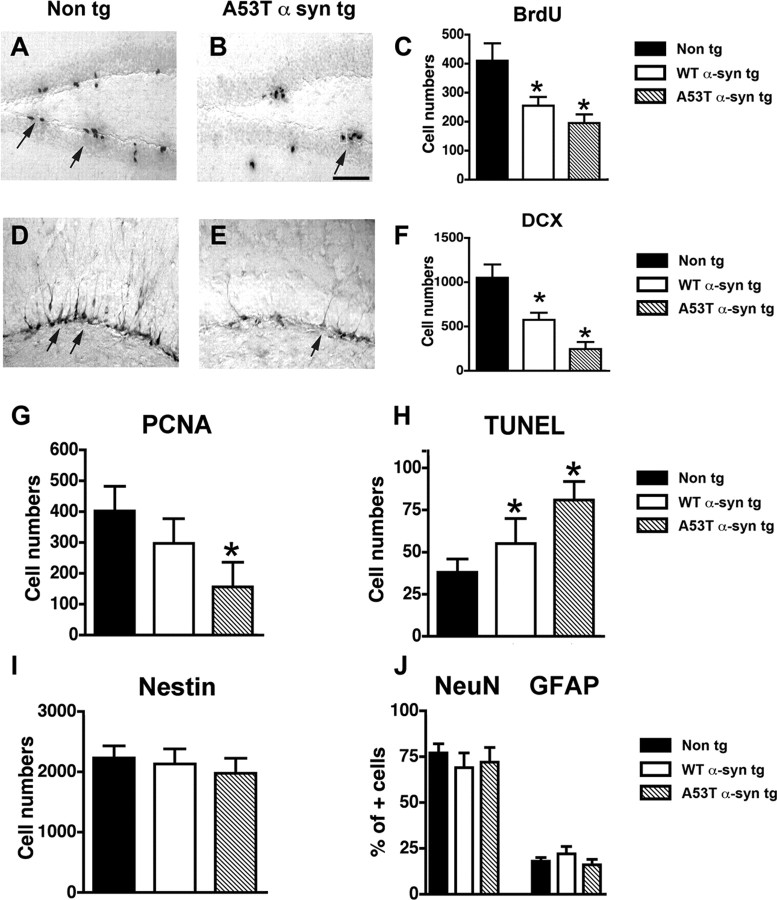
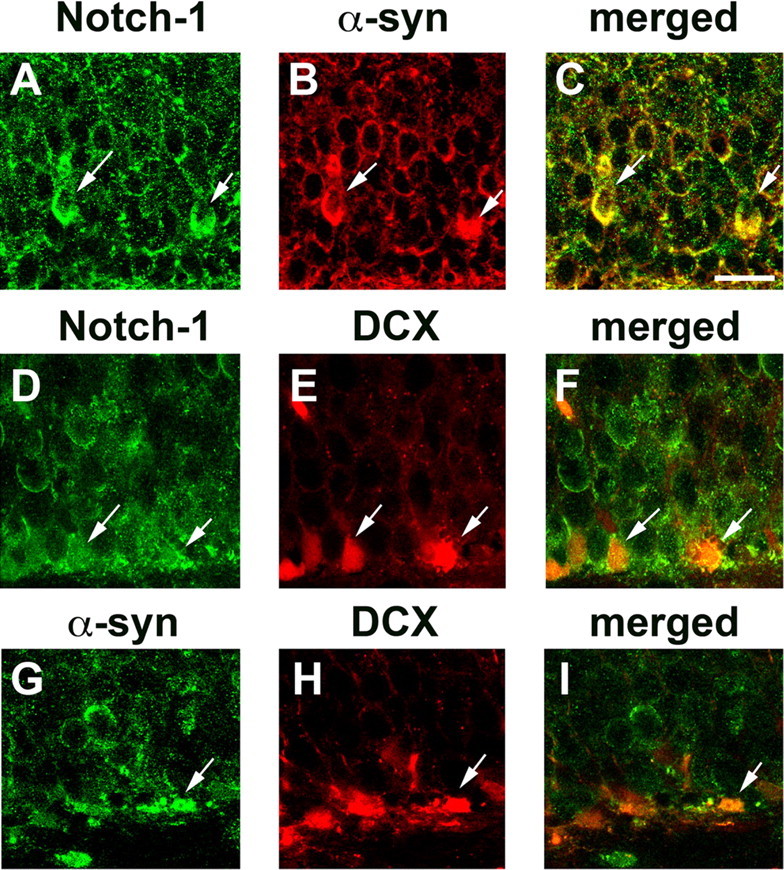
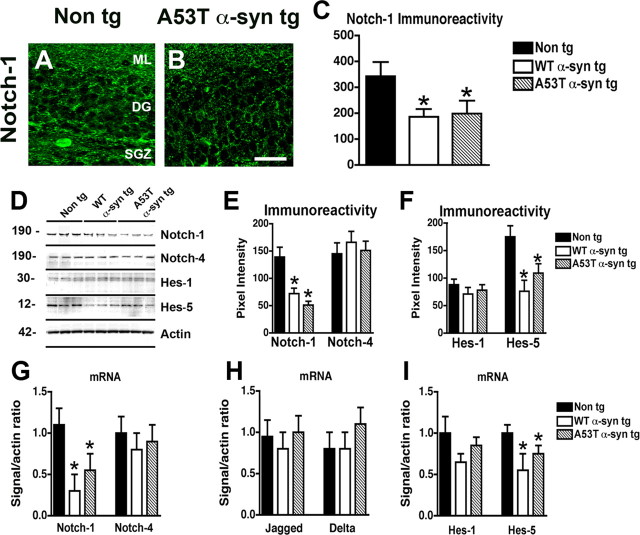
Altered expression and mutations in alpha-synuclein (alpha-syn) have been linked to Parkinson's disease (PD) and related disorders. The neurological alterations in PD patients have been associated with degeneration of dopaminergic cells and other neuronal populations. Moreover, recent studies in murine models have shown that alterations in neurogenesis might also contribute to the neurodegenerative phenotype. However, the mechanisms involved and the effects of alpha-syn expression on neurogenesis are not yet clear. To this end, murine embryonic stem (mES) cells were infected with lentiviral (LV) vectors expressing wild-type (WT) and mutant alpha-syn. Compared with mES cells infected with LV-green fluorescent protein (GFP), cells expressing WT and mutant alpha-syn showed reduced proliferation as indicated by lower 5-bromo-2'-deoxyuridine uptake, increased apoptosis, and reduced expression of neuronal markers such as neuron specific enolase and beta-III tubulin. The alterations in neurogenesis in alpha-syn-expressing mES cells were accompanied by a reduction in Notch-1 and Hairy and enhancer of split-5 (Hes-5) mRNA and protein levels. Moreover, levels of total Notch-1 and Notch intracellular domain (NICD) were lower in mES cells expressing WT and mutant alpha-syn compared with GFP controls. The reduced survival of alpha-syn-expressing mES cells was reverted by overexpressing constitutively active NICD. Similarly, in alpha-syn transgenic mice, the alterations in neurogenesis in the hippocampal subgranular zone were accompanied by decreased Notch-1, NICD, and Hes-5 expression. Together, these results suggest that accumulation of alpha-syn might impair survival of NPCs by interfering with the Notch signaling pathway. Similar mechanisms could be at play in PD and Lewy body disease.


Figures

Figure 1.
Figure 1.
Neuronal differentiation of mES cells. A, Schematic representation of neuronal differentiation procedure. mES cells were cultured on 0.1% gelatin-coated plate and grown as a monolayer (stage A). mES cells on nonadherent dishes form embryoid bodies (stage B). After 4 d of embryoid body formation, retinoic acid was added (stage C). Embryoid bodies were dissociated and plated on poly-ornithine/laminin-coated plates in N2 medium (stage D). After 2 d, medium was replaced with B27 medium and cultured for 8 d (stage E). B–F, Phase-contrast images of the mES cells during the differentiation process. G–K, Expression of the neuronal marker β-tubulin in the mES cells during differentiation. L–P, Lentivirus-mediated transduction of GFP into mES cells. Scale bar: (in F) B, E–P, 30 μm; C, D, 60 μm.
Figure 2.
Figure 2.
Effects of α-syn on neurogenesis in mES cells. A–I, Lentivirus-mediated α-syn expression in mES cells. Vector-, WT α-syn-, or A53T mut α-syn (A53T)-transduced mES cells were harvested at stage E8. α-Synuclein accumulated in cell bodies (arrows) and was accompanied by decreased levels of the neuronal differentiation marker β-tubulin. Scale bar, 20 μm. J, Quantification of neurite lengths in vector-, WT α-syn-, and A53T mut α-syn-infected differentiated (stage E8) mES cells. K, Semiquantitative analysis of levels of β-tubulin expression in stage E8 mES cells. L, Vector-, WT α-syn-, or A53T mut α-syn-transduced cells were harvested at the indicated stages. Proteins in total cell lysates were separated by SDS-PAGE and immunoblotted with anti-β-tubulin, anti-α-syn, or anti-β-actin, as indicated. M, Quantitative analysis of immunoblot levels of β-tubulin. N, α-Synuclein overexpression decreased proliferation of differentiating neuronal cells. Dissociated embryoid bodies were cultured using the neuronal differentiation protocol. After 9 d (day E7), BrdU (10 μm final concentration) was added, and the cells were incubated for 24 h. The cells were fixed and incubated with anti-BrdU-peroxidase. Peroxidase substrate was added and measured at 405 nm. O, Increased TUNEL-positive cells in α-syn-infected differentiated mES cells at stage E8. *p < 0.01 compared with vector-infected control cells (one-way ANOVA with post hoc Dunnett's test). OD, Optical density.
Figure 3.
Figure 3.
Effects of α-syn on Notch-1 expression in mES cells. A, Immunoblot analysis of neuronal differentiated cells harvested at stage E8. Proteins in total cell lysates were separated by SDS-PAGE and immunoblotted with anti-β-tubulin, anti-Notch-1 (full-length), anti-NICD, or anti-β-actin. B, Quantification of Notch-1 expression (normalized to β-actin levels). C–E, Double-immunolabeling analysis of differentiated neuronal cells at stage E8 with antibodies against Notch-1 and β-tubulin. Scale bar, 30 μm. F, Levels of Notch-1 immunoreactivity in stage E8 differentiated neuronal cells infected with LV–vector, WT α-syn, or A53T mut α-syn. G, mRNA expression of Notch-1 and Notch-4 as measured by qPCR in stage E8 neuronal differentiated mES cells infected with LV–vector, WT α-syn, or A53T mut α-syn. H, mRNA expression of Jagged and Delta as measured by qPCR in stage E8 neuronal differentiated mES cells infected with LV–vector, WT α-syn, or A53T mut α-syn. I, mRNA expression of Hes-1 and Hes-5 as measured by qPCR in stage E8 neuronal differentiated mES cells infected with LV–vector, WT α-syn, or A53T mut α-syn. J, γ-Secretase activity in stage E8 differentiated mES cells infected with LV–vector, WT α-syn, or A53T mut α-syn. *p < 0.05 compared with vector-infected control cells (one-way ANOVA with post hoc Dunnett's test).
Figure 4.
Figure 4.
NICD reversed the decrease in neuronal differentiation and proliferation in α-syn-transduced cells. A, Adenovirus-mediated (MOI of 3) NICD–HA expression in stage E8 neuronal differentiated cells infected with LV–vector, WT α-syn, or A53T mut α-syn. Proteins in total cell lysates were separated by SDS-PAGE and immunoblotted with antibodies against β-tubulin, α-syn, HA, or β-actin. B, NICD expression reversed the decrease in β-tubulin expression in α-syn-transduced cells. C, NICD expression reversed the decrease of cell proliferation in α-syn-transduced cells. Cells were incubated with BrdU (10 μm final concentration) on day E7. After 24 h (E8), the cells were fixed and incubated with anti-BrdU-peroxidase. Peroxidase substrate was added and measured at 405 nm. D, NICD reduced the numbers of TUNEL-positive cells in α-syn-expressing cells. *p < 0.05 compared with vector-infected control cells (one-way ANOVA with post hoc Dunnett's test). OD, Optical density.
Figure 5.
Figure 5.
Alterations in neurogenesis in α-syn tg mice. Images are from the SGZ of the DG of 5-month-old mice (n = 5). A, BrdU-positive cells (arrows) in a non-tg mouse 30 d after BrdU treatment. B, Reduced numbers of surviving BrdU-positive cells (arrow) in A53T mut α-syn tg mouse 30 d after BrdU treatment. C, Analysis of total numbers of BrdU-positive cells in the SGZ. D, DCX-positive newly formed neuroblasts (arrows) in a non-tg mouse. E, Reduced numbers of DCX-positive newly formed neuroblasts (arrow) in A53T mut α-syn tg mouse. Scale bar, 50 μm. F, Analysis of total numbers of DCX-positive cells in the SGZ. G, Comparison of numbers of PCNA-positive cells in the DG. H, Comparison of total numbers of TUNEL-positive cells in the DG. I, Comparison of numbers of nestin-positive cells in the DG. J, Comparison of numbers of BrdU-positive cells colabeled with NeuN or GFAP in the DG. *p < 0.05 compared with non-tg control (one-way ANOVA with post hoc Dunnett's test).
Figure 6.
Figure 6.
Coexpression of α-syn with markers of neurogenesis and Notch signaling in the brains of α-syn tg mice. Images are from the SGZ of the DG of 5-month-old A53T mut α-syn tg mice. A–C, Colocalization in neuroblasts (arrows) of Notch-1 and α-syn. D–F, Colocalization (arrows) of Notch-1 and DCX. G–I, Colocalization (arrows) of α-syn and DC. Scale bar, 20 μm.
Figure 7.
Figure 7.
Immunocytochemical, immunoblot, and qPCR analyses of the effects of α-syn on Notch expression in the hippocampus of tg mice. Images are from the DG, including the molecular layer (ML), DG, and SGZ of 5-month-old mice (n = 5). A, Patterns of Notch-1 expression in the SGZ of a non-tg mouse. B, Reduced Notch-1 expression in an A53T mut α-syn tg mice. Scale bar, 50 μm. C, Analysis of levels of Notch-1 expression (immunoreactivity) in the DG. D, Proteins in brain homogenates from non-tg, WT α-syn tg, and A53T mut α-syn tg mice were separated by SDS-PAGE and immunoblotted with antibodies against Notch-1, Notch-4, Hes-1, Hes-5, or β-actin, as indicated. E, Quantitative analysis of immunoblot levels of Notch-1 and Notch-4. F, Quantitative analysis of immunoblot levels of Hes-1 and Hes-5. G, Comparison of levels of Notch-1 and Notch-4 mRNA in the hippocampus by qPCR. H, Comparison of levels of Jagged and Delta mRNA in the hippocampus by qPCR. I, Comparison of levels of Hes-1 and Hes-5 mRNA in the hippocampus by qPCR. *p < 0.05 compared with non-tg control (one-way ANOVA with post hoc Dunnett's test).

References

    1. Bibel M, Richter J, Schrenk K, Tucker KL, Staiger V, Korte M, Goetz M, Barde YA. Differentiation of mouse embryonic stem cells into a defined neuronal lineage. Nat Neurosci. 2004;7:1003–1009. - PubMed
    1. Biebl M, Winner B, Winkler J. Caspase inhibition decreases cell death in regions of adult neurogenesis. NeuroReport. 2005;16:1147–1150. - PubMed
    1. Breunig JJ, Silbereis J, Vaccarino FM, Sestan N, Rakic P. Notch regulates cell fate and dendrite morphology of newborn neurons in the postnatal dentate gyrus. Proc Natl Acad Sci USA. 2007;104:20558–20563. - PMC - PubMed
    1. Brown J, Cooper-Kuhn CM, Kempermann G, Van Praag H, Winkler J, Gage FH, Kuhn HG. Enriched environment and physical activity stimulate hippocampal but not olfactory bulb neurogenesis. Eur J Neurosci. 2003;17:2042–2046. - PubMed
    1. Duce JA, Smith DP, Blake RE, Crouch PJ, Li QX, Masters CL, Trounce IA. Linker histone H1 binds to disease associated amyloid-like fibrils. J Mol Biol. 2006;361:493–505. - PubMed

Publication types

MeSH terms

LinkOut - more resources