

High perfusion pressure accelerates renal injury in salt-sensitive hypertension
- PMID: 18417720
- PMCID: PMC2488259
- DOI: 10.1681/ASN.2007121271
High perfusion pressure accelerates renal injury in salt-sensitive hypertension
Abstract
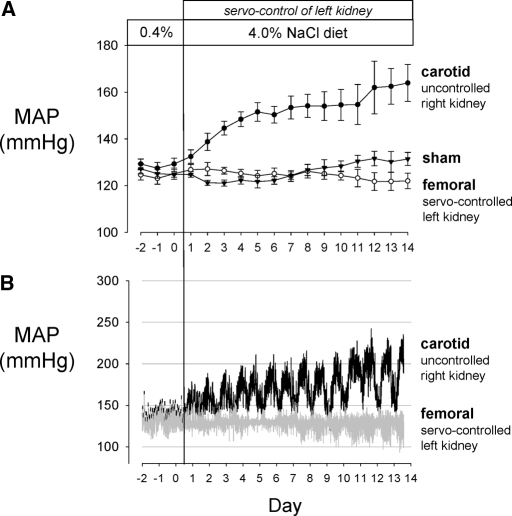
Renal injury in the Dahl salt-sensitive rat mimics human salt-sensitive forms of hypertension that are particularly prevalent in black individuals, but the mechanisms that lead to the development of this injury are incompletely understood. We studied the impact of renal perfusion pressure (RPP) on the development of renal injury in this model. During the development of salt-induced hypertension over 2 wk, the RPP to the left kidney was maintained at control levels (125 +/- 2 mmHg) by continuous servocontrol inflation of an aortic balloon implanted between the renal arteries; during the same period, the RPP to the right kidney rose to 164 +/- 8 mmHg. After 2 wk of a 4% salt diet, DNA microarray and real-time PCR identified genes related to fibrosis and epithelial-to-mesenchymal transition in the kidneys exposed to hypertension. The increased RPP to the right kidney accounted for differences in renal injury between the two kidneys, measured by percentage of injured cortical and juxtamedullary glomeruli, quantified proteinaceous casts, number of ED-1-positive cells per glomerular tuft area, and interstitial fibrosis. Interlobular arteriolar injury was not increased in the kidney exposed to elevated pressure but was reduced in the control kidney. We conclude that elevations of RPP contribute significantly to the fibrosis and epithelial-to-mesenchymal transition found in the early phases of hypertension in the salt-sensitive rat.
Figures
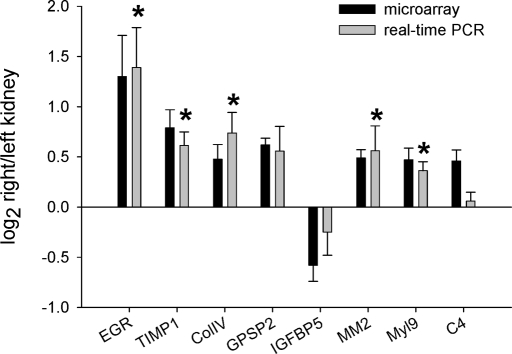
 ); n = 6 for microarray, n = 6 for real-time PCR; *P < 0.05. C4, complement C4; Col IVα1, collagen type IV α1; EGR1, early growth response 1; GPSP2, regulator of G-protein signaling protein 2; IGFBP5, insulin-like growth factor-binding protein 5; MM2, matrix metalloproteinase 2; Myl9, myosin regulatory light chain Myl9; TIMP-1, tissue inhibitor of metalloproteinase 1.
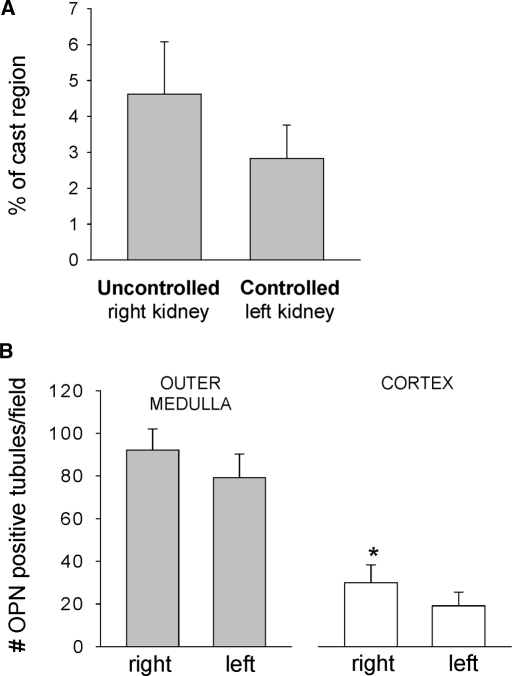
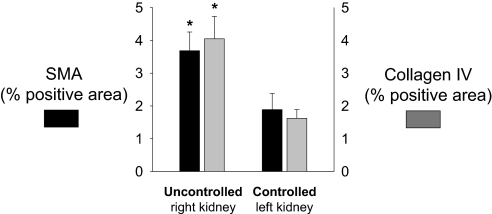 ) was greater in the outer medulla of the uncontrolled right kidney than the controlled left kidney (n = 6; *P < 0.05).
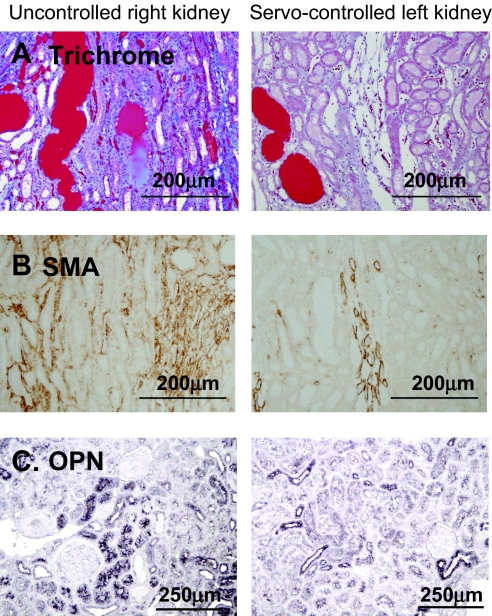
 ) glomeruli. The protected, servocontrolled left kidney had significantly fewer injured glomeruli in both regions than in the uncontrolled, high-pressure right kidney (n = 6; *P < 0.05). Sham left kidney was not significantly different from the servocontrolled left kidney (Table 2).
References
-
- Rapp JP, Dene H: Development and characteristics of inbred strains of Dahl salt-sensitive and salt-resistant rats. Hypertension 7: 340–349, 1985 - PubMed
-
- Cowley AW Jr., Roman RJ, Kaldunski ML, Dumas P, Dickhout JG, Greene AS, Jacob HJ: Brown Norway chromosome 13 confers protection from high salt to consomic Dahl S rat. Hypertension 37: 456–461, 2001 - PubMed
-
- Chen PY, St. John PL, Kirk KA, Abrahamson DR, Sanders PW: Hypertensive nephrosclerosis in the Dahl/Rapp rat Initial sites of injury and effect of dietary L-arginine administration. Lab Invest 68: 174–184, 1993 - PubMed
-
- Rostand GS, Kirk KA, Rutsky EA, Pate BA. Racial differences in the incidence of treatment for end-stage renal disease. N Engl J Med 306: 1276–1279, 1982 - PubMed
-
- Siegel AK, Kossmehl P, Planert M, Schulz A, Wehland M, Stoll M, Bruijn JA, de Heer E, Kreutz R: Genetic linkage of albuminuria and renal injury in Dahl salt-sensitive rats on a high-salt diet: Comparison with spontaneously hypertensive rats. Physiol Genomics 18: 218–225, 2004 - PubMed
Publication types
MeSH terms
Substances
Grants and funding
LinkOut - more resources
Full Text Sources
Medical
