Review
. 2008 Jul 19;190(2):165-73.
doi: 10.1016/j.bbr.2008.02.044. Epub 2008 Mar 12.

Tactile intensity and population codes

Affiliations
Review

Tactile intensity and population codes

Sliman J Bensmaia. Behav Brain Res. .

Abstract

An important question in neuroscience is how different aspects of a stimulus are encoded at different stages of neural processing. In this review, I discuss studies investigating the peripheral neural code for perceived intensity in touch. One of the recurrent themes in this line of research is that information about stimulus intensity is encoded in the activity of populations of neurons. Not only is information integrated across afferents of a given type, but information is also combined across submodalities to yield a unified percept of stimulus intensity. The convergence of information stemming from multiple submodalities is particularly interesting in light of the fact that these are generally thought to be parallel sensory channels with distinct sensory functions and little cross-channel interactions. I discuss implications of a recently proposed model of intensity coding for psychophysical functions and for the coding of intensity in cortex. I also briefly review the peripheral coding of intensity in other sensory modalities.


Figures

Figure 1
Figure 1
Responses (in impulses per stimulus cycle) of a typical SA1 afferent to 10-Hz sinusoids varying in amplitude from 2.5 to 250μm. Over wide ranges of amplitude (from about 40 to 115μm, for instance), the afferent’s response does not change with changes in stimulus amplitude.
Figure 2
Figure 2
Four exemplars of the three types of stimuli presented by Muniak et al. [14]. Top: Sinusoids at 5, 20, 50 and 100Hz. Middle: Diharmonic waves (two superimposed sinusoids) with frequency components 5Hz + 10Hz, 10Hz + 50Hz, 25Hz + 75Hz, and 50Hz + 100Hz. Bottom: Noise stimuli with the low frequency cut-off at 5Hz and the high-frequency cut-off at 10, 25, 50 and 100Hz.
Figure 3
Figure 3
Responses of five neurons of each type to vibratory stimuli at 4 frequencies and 2 amplitudes. Each row of plots shows the response of a different type of afferent; each column of plots shows reponses to sinusoids at different frequencies. For each afferent of each type, whose responses are shown in one of five colors (blue, red, green, magenta and cyan), the stimulus (shown at the bottom of each plot) was presented five times. At each frequency, responses are shown for stimuli at two amplitudes: Responses to the low amplitude-stimulus are shown in the shaded area, responses to the high-amplitude stimulus are shown in the non-shaded area. Amplitudes are shown to the right of the corresponding raster plots.
Figure 4
Figure 4
The black area shows the spatial extent of the “hot zone,” centered on the locus of stimulation, the spatial extent of which is denoted by a yellow patch. Over the “hot zone,” the effective amplitude remains constant. The effective amplitude then drops off as and inverse square function of distance from the “hot zone.” The green shading shows the drop-off of the effective stimulus amplitude as a function of distance from the center of the stimulating probe. According to the population coding hypothesis, responses of afferents whose RFs are in the black, yellow and green regions contribute to perceived intensity; according to the “hot zone” model, only afferents whose RFs are in the black and yellow regions contribute to the perception of stimulus intensity.
Figure 5
Figure 5
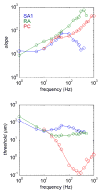
Slopes and intercepts (thresholds) of the rate-intensity functions of SA1, RA and PC fibers as a function of frequency. The form of the function was f(a) = [α(log(a) − log(β))] +where f(a) is the firing rate evoked by a stimulus of amplitude a and α and β are parameters fit to the mean rate-intensity functions obtained at each frequency for each type of afferent. The plus (+) sign denotes rectification (if f(a) < 0, f(a) is set to 0). As can be seen from the figure, SA1 afferents are most sensitive at the low frequencies, PC fibers at the high frequencies, and RA afferents at intermediate frequencies.
Figure 6
Figure 6
Predictions derived from the “hot zone” codes. a-c) Perceived intensity plotted against the firing rates evoked in SA1 (a), RA (b) and PC (c) fibers whose RFs are located in the “hot zone.” The strength and linearity of the relationship between the mean rate evoked in each population of afferents and perceived intensity reveals the degree to which the “hot zone” model is predictive of perceived intensity if only signals from a single population contribute to the perception of stimulus intensity. All three populations of fibers yield good fits when considered individually, but no one population accounts for all aspects of perceived intensity. d) Predictions derived from the multiple regression of perceived intensity on firing rates of afferents whose RFs are located in the “hot zone.” Note that predictions obtained from the total population response were similar to those derived from the “hot zone” hypothesis (R2 was 0.97 for the “hot zone” model and 0.95 for the population model).
Figure 7
Figure 7
Predicted perceived intensity for sinusoids at 20, 50 and 250Hz. As the stimulus frequency increases, the exponent of the power function relating perceived intensity to stimulus amplitude decreases as has been shown in extant psychophysical studies. Predictions are derived from the hypothesis that the total population firing rate determines perceived intensity. To obscure the multiple branches of individual functions, we generated 10 sets of predictions at each frequency, each with 20% jitter around the mean slopes and intercepts of the measured SA1, RA and PC rate-intensity functions (see text) to simulate variability across subjects. Each point is the mean of 10 simulated responses. The fitted exponents were 0.92, 0.88 and 0.45 [c.f. 15;17]. The dependence of the exponent on stimulus frequency disappears when the PC contribution is eliminated.

References

    1. Stevens SS. On the psychophysical law. Psychol Rev. 1957;64:153–181. - PubMed
    1. Mountcastle VB, Talbot WH, Sakata H, Hyvärinen J. Cortical neuronal mechanisms in flutter-vibration studied in unanesthetized monkeys. Neuronal periodicity and frequency discrimination. J Neurophysiol. 1969;32:452–484. - PubMed
    1. Bolanowski SJ, Gescheider GA, Verrillo RT, Checkosky CM. Four channels mediate the mechanical aspects of touch. J Acoust Soc Am. 1988;84:1680–1694. - PubMed
    1. Johnson KO. The roles and functions of cutaneous mechanoreceptors. Curr Opin Neurobiol. 2001;11:455–461. - PubMed
    1. Hsiao SS, Bensmaia S. Coding of Object shape and texture. In: Kass JH, Basbaum AI, editors. Somatosensation Volume of the Handbook of the Senses. 2006.

Publication types