. 2008 Jun;41(2):189-203.
doi: 10.1016/j.neuroimage.2008.02.061. Epub 2008 Mar 14.

Coupling between somatosensory evoked potentials and hemodynamic response in the rat

Affiliations

Coupling between somatosensory evoked potentials and hemodynamic response in the rat

Maria Angela Franceschini et al. Neuroimage. 2008 Jun.

Abstract

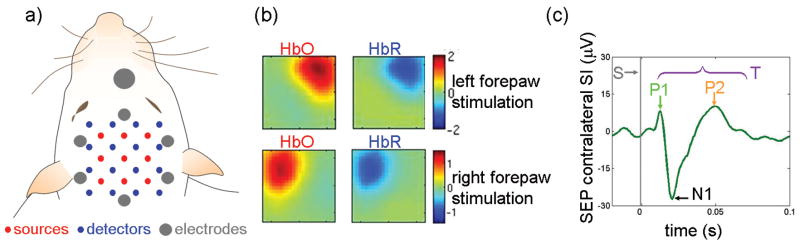
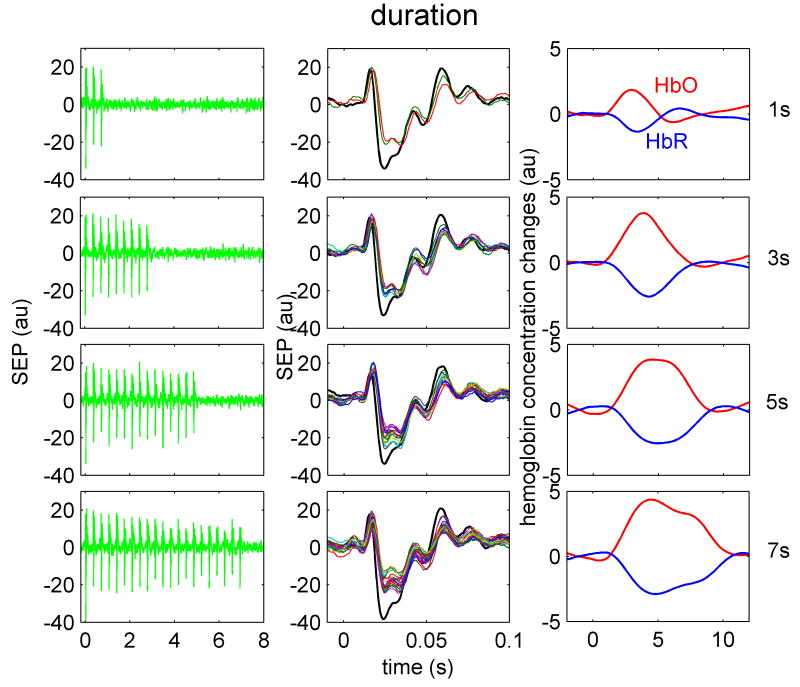
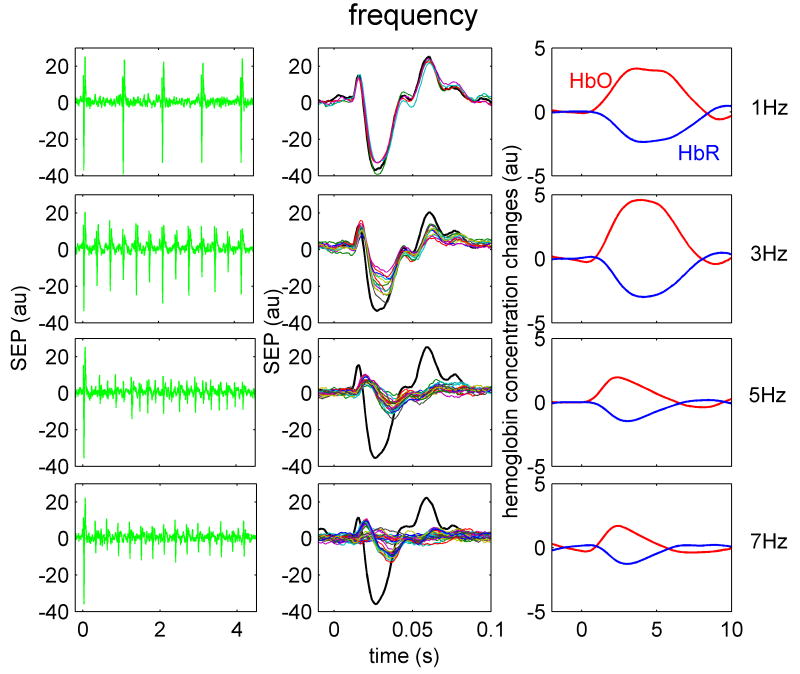
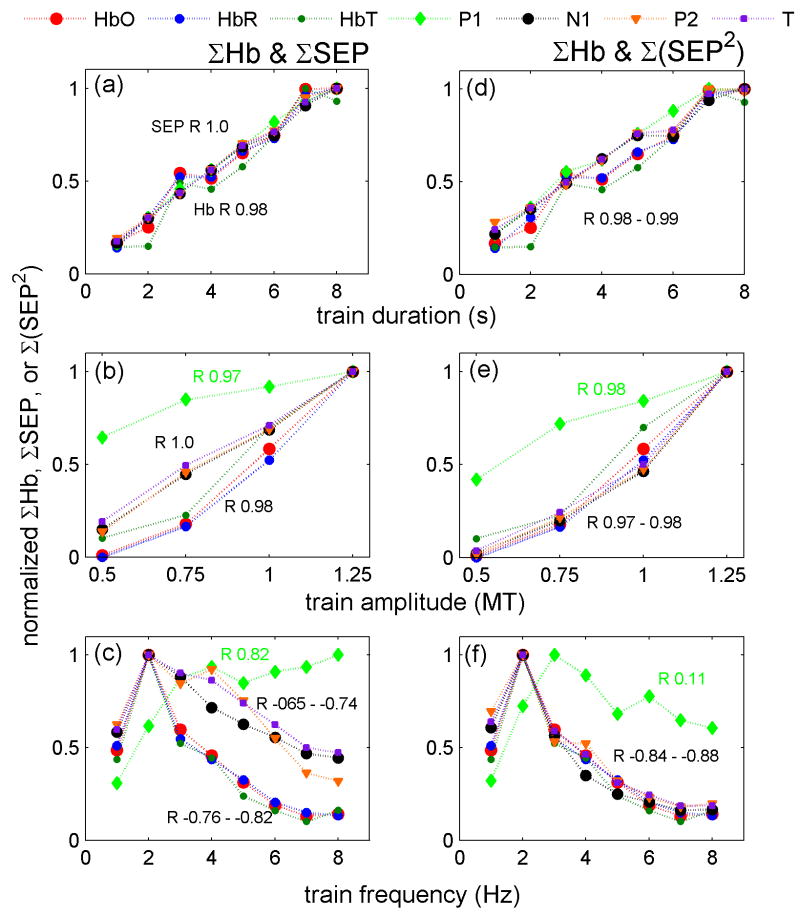
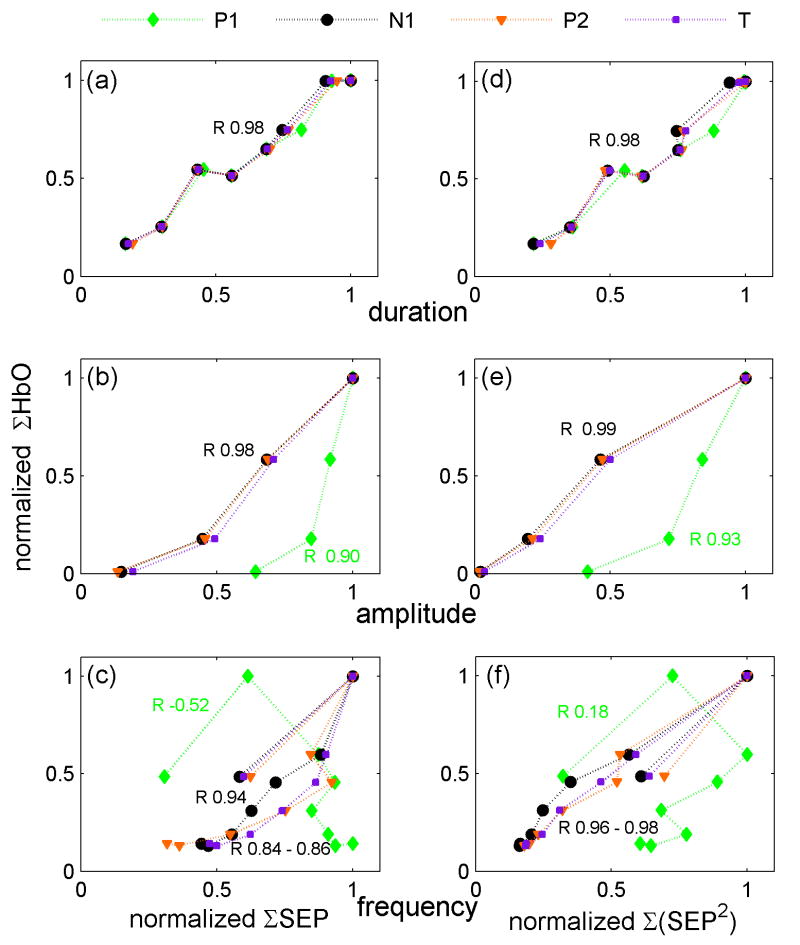
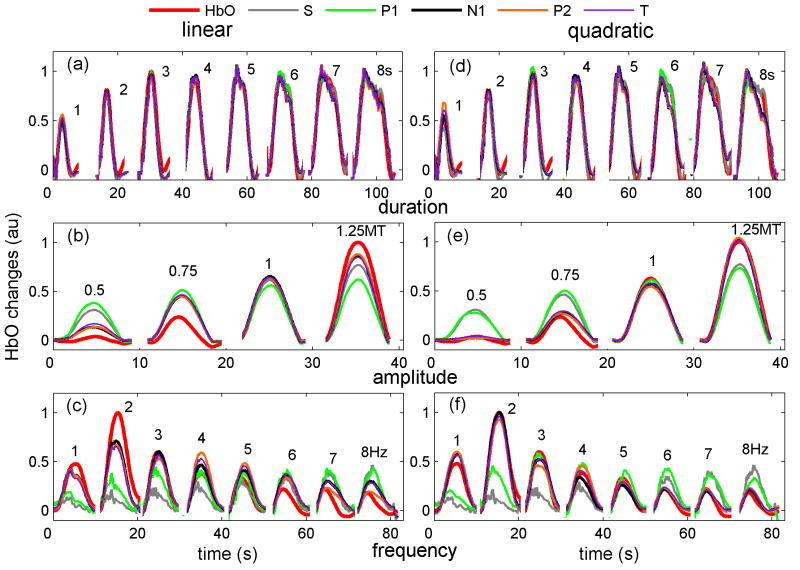
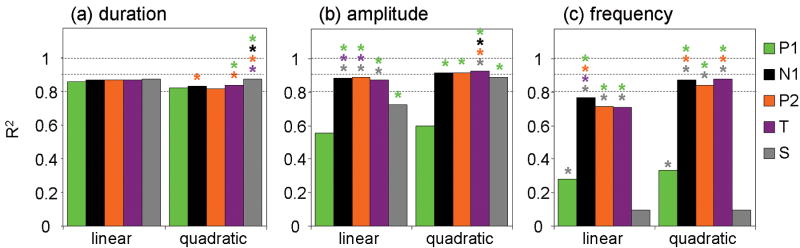
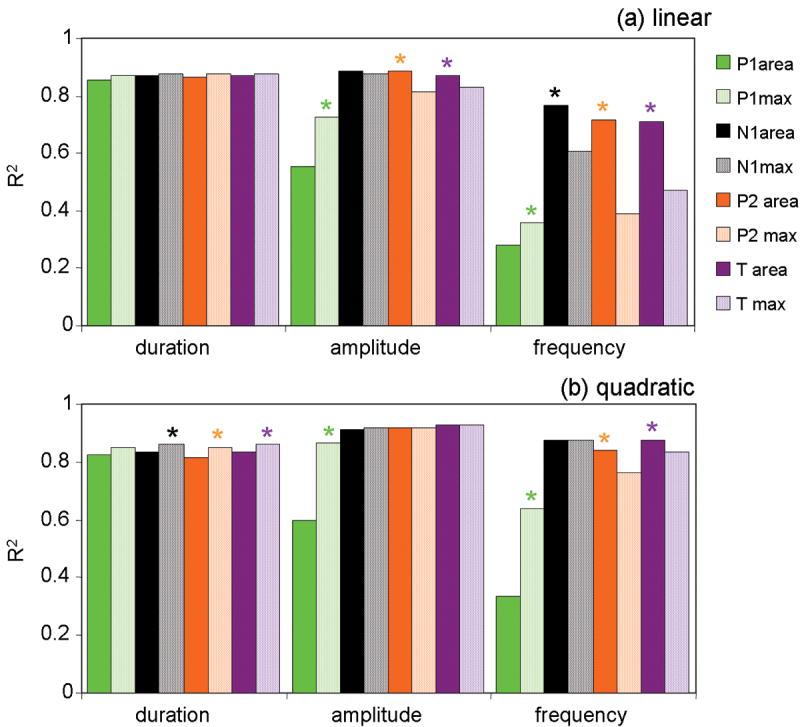
We studied the relationship between somatosensory evoked potentials (SEP) recorded with scalp electroencephalography (EEG) and hemoglobin responses recorded non-invasively with diffuse optical imaging (DOI) during parametrically varied electrical forepaw stimulation in rats. Using these macroscopic techniques we verified that the hemodynamic response is not linearly coupled to the somatosensory evoked potentials, and that a power or threshold law best describes the coupling between SEP and the hemoglobin response, in agreement with the results of most invasive studies. We decompose the SEP response in three components (P1, N1, and P2) to determine which best predicts the hemoglobin response. We found that N1 and P2 predict the hemoglobin response significantly better than P1 and the input stimuli (S). Previous electrophysiology studies reported in the literature show that P1 originates in layer IV directly from thalamocortical afferents, while N1 and P2 originate in layers I and II and reflect the majority of local cortico-cortical interactions. Our results suggest that the evoked hemoglobin response is driven by the cortical synaptic activity and not by direct thalamic input. The N1 and P2 components, and not P1, need to be considered to correctly interpret neurovascular coupling.


Figures

Figure 1
Figure 1
a: Position of the optical probe and EEG electrodes relative to the head of the animal. In addition, surface electrodes were positioned on the rat's nose (ground), neck (reference) and torso (2 ECG and one ground). b: oxy and deoxy-hemoglobin concentration changes (HbO and HbR, respectively) maps for one rat during 4 s, 3 Hz, above motor threshold (MT) stimulation. c: Corresponding SEP response due to left forepaw stimulation. Gray vertical line = input stimuli (S), T=total SEP signal. The times to peak of the three SEP components across animals in all experiments were: P1 17±2 ms, N1 31±4 ms, and P2 66±8 ms. We didn't detect a clear N2 component, hence it wasn't considered in our analysis. DOI signals are deconvolved and EEG signals are block averaged in each run and across the 12 runs.
Figure 2
Figure 2
Temporal SEP and hemoglobin response traces to four different train durations in one animal. Train durations, from top to bottom are 1, 3, 5, 7 s, respectively. Left panels are the SEP responses to stimulation train. Middle panels are the overlapped SEP responses for each individual stimulus in the train. The black trace represents the response to the first stimulus in the train. The right panel illustrates the HbO (red) and HbR (blue) responses for the corresponding train. Both SEP and hemoglobin responses shown are averaged over the same number of trains during all stimulation runs.
Figure 3
Figure 3
Temporal SEP and hemoglobin response traces to four different amplitudes in one animal. Train amplitudes, from top to bottom are 0.5, 0.75, 1, 1.25 MT (motor threshold), respectively. Left panels are the SEP responses to stimulation train. Middle panels are the overlapped SEP responses for each individual stimulus in the train. The black trace represents the response to the first stimulus in the train. The right panel illustrates the HbO (red) and HbR (blue) responses for the corresponding train. Both SEP and hemoglobin responses shown are averaged over the same number of trains during all stimulation runs.
Figure 4
Figure 4
Temporal SEP and hemoglobin response traces to four different train frequencies in one animal. Train frequencies, from top to bottom are 1, 3, 5 and 7 Hz, respectively. Left panels are the SEP responses to stimulation train. Middle panels are the overlapped SEP responses for each individual stimulus in the train. The black trace represents the response to the first stimulus in the train. The right panel illustrates the HbO (red) and HbR (blue) responses for the corresponding train. Both SEP and hemoglobin responses shown are averaged over the same number of trains during all stimulation runs.
Figure 5
Figure 5
ΣHbO, ΣHbR, ΣHbT (HbT = total hemoglobin concentration = HbO+HbR) (both left and right panels), ΣSEP (left panels) and Σ(SEP2) (right panels) vs. stimulus conditions for the grand average of all rats. Panels a and d duration, panels b and e amplitude, and panels c and f frequency experiments. The correlation coefficients (R) are reported next to the corresponding traces. In the duration and amplitude experiment (panels a and d), the SEP, the squared SEP and the hemoglobin responses are almost linear with the input stimuli. For the frequency experiment (panels c and f), there is a strong non-linearity and anticorrelation between S and either N1, P2 and T SEP components or hemodynamic responses. In fact, both SEP and the hemodynamic responses decrease with increased frequency. In all experiments the squared SEP dependence on the input stimuli is very close to that of the hemodynamic responses
Figure 6
Figure 6
Panels a, b and c show the scatter plots of normalized ΣHbO and ΣSEP components for the grand averages of all rats. Panels d, e and f, the r scatter plots of normalized ΣHbO and Σ(SEP2) components. Panels a and d: duration, b and e: amplitude, c and f: frequency experiments. The correlation coefficients (R) are reported next to the corresponding traces. The results for HbR and HbT, not shown, are similar. In the duration experiment (panels a and d), the integrated SEP responses are linear with the integrated hemoglobin responses. In the amplitude and frequency experiments, the integrated P1 SEP responses are not linear with the hemodynamic responses. For both amplitude and frequency experiments, N1, P2 and T are more linear with the hemodynamic responses by considering Σ(SEP2) (panels e and f) than by using ΣSEP.
Figure 7
Figure 7
Grand average of the measured oxy-hemoglobin (HbO=red) response with predicted hemodynamic response using the input stimuli (S=gray), the SEP components P1 (green), N1 (black), P2 (orange), and the total SEP response (T=purple) using linear (panels a, b and c) and quadratic (panels d, e and f) convolution models. Panels a and d duration experiment; panels b and e amplitude experiment; panels c and f frequency experiment. The input stimuli and the P1 component are not able to predict the hemodynamic response in the amplitude and frequency experiments. Instead N1, P2 and T using a quadratic model are able to predict quite well the hemodynamic response in all experiments.
Figure 8
Figure 8
Coefficients of determination between simulated and measured oxy-hemoglobin response across animals for the linear and quadratic convolution models for the three protocols: duration (a), amplitude (b), and frequency (c). P1 (green), N1 (black), P2 (orange), and the total SEP response (T=purple). Color coded * indicates statistically significant larger R2 than for the corresponding color component, P<0.05, multifactor ANOVA. Across the three experiments, the N1 and P2 components consistently provide better R2 than P1 and S.
Figure 9
Figure 9
Comparison of the coefficients of determination between simulated and measured oxy-hemoglobin responses using the SEP area or the SEP peak amplitude (max) as inputs for the linear (panel a) and quadratic (panel b) convolution models. P1 (green), N1 (black), P2 (orange), and the total SEP response (T=purple), solid bars area, dotted bars peak amplitude. For each component * indicates statistically significant larger R2 between area and max, P<0.05, multifactor ANOVA. P1 R2 is larger using the max than the area in the frequency experiment. Across experiments P2 predictions are significantly worse using the max than using the area.

References

    1. Adrian ED. Afferent discharges to the cerebral cortex from peripheral sense organs. J Physiol. 1941;100:159–191. - PMC - PubMed
    1. Agmon A, Connors BW. Thalamocortical responses of mouse somatosensory (barrel) cortex in vitro. Neuroscience. 1991;41:365–379. - PubMed
    1. Allison T, McCarthy G, Wood CC, Darcey TM, Spencer DD, Williamson PD. Human cortical potentials evoked by stimulation of the median nerve. I. Cytoarchitectonic areas generating short-latency activity. J Neurophysiol. 1989a;62:694–710. - PubMed
    1. Allison T, McCarthy G, Wood CC, Williamson PD, Spencer DD. Human cortical potentials evoked by stimulation of the median nerve. II. Cytoarchitectonic areas generating long-latency activity. J Neurophysiol. 1989b;62:711–722. - PubMed
    1. Ances BM, Zarahn E, Greenberg JH, Detre JA. Coupling of neural activation to blood flow in the somatosensory cortex of rats is time-intensity separable, but not linear. J Cereb Blood Flow Metab. 2000;20:921–930. - PubMed

Publication types