Review
. 2008 May;12(5):201-8.
doi: 10.1016/j.tics.2008.02.009. Epub 2008 Apr 15.

Hierarchical models of behavior and prefrontal function

Affiliations
Review

Hierarchical models of behavior and prefrontal function

Matthew M Botvinick. Trends Cogn Sci. 2008 May.

Abstract

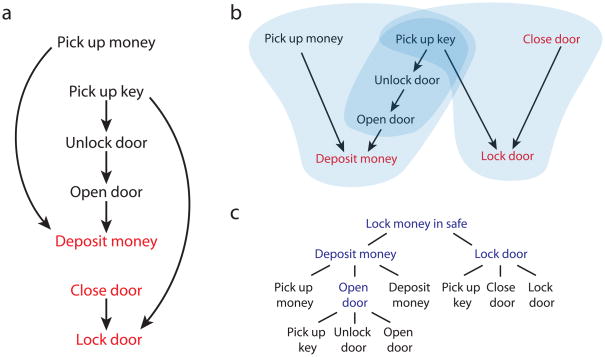
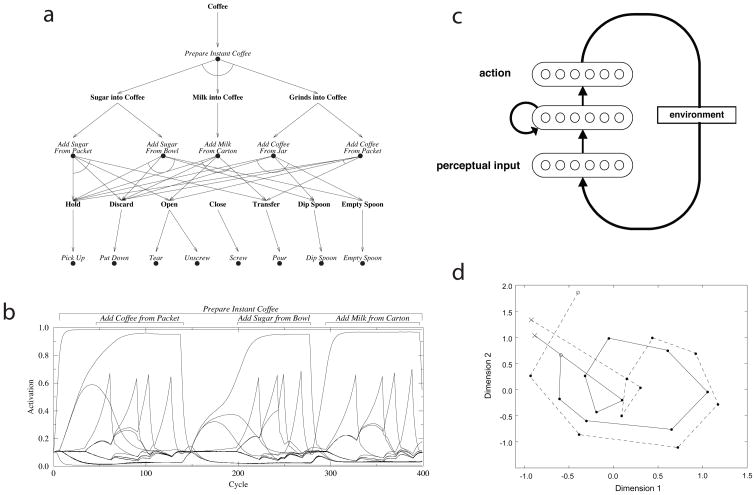
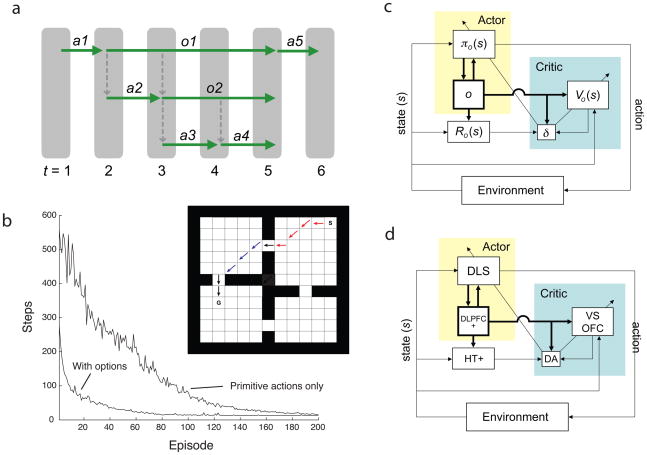
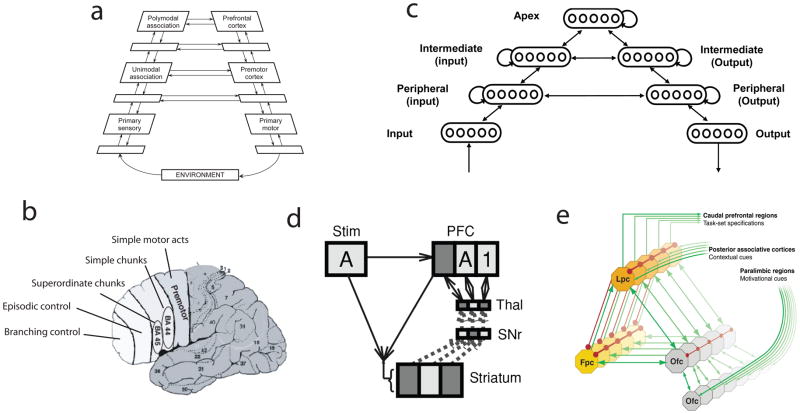
The recognition of hierarchical structure in human behavior was one of the founding insights of the cognitive revolution. Despite decades of research, however, the computational mechanisms underlying hierarchically organized behavior are still not fully understood. Recent findings from behavioral and neuroscientific research have fueled a resurgence of interest in the problem, inspiring a new generation of computational models. In addition to developing some classic proposals, these models also break fresh ground, teasing apart different forms of hierarchical structure, placing a new focus on the issue of learning and addressing recent findings concerning the representation of behavioral hierarchies within the prefrontal cortex. In addition to offering explanations for some key aspects of behavior and functional neuroanatomy, the latest models also pose new questions for empirical research.


Figures

Figure 1
Figure 1
An illustration of hierarchical instrumental structure. a) An action sequence for locking money in a safe. Arrows denote means-ends relationships. Red indicates that the action accomplishes one component of the goal (money in the safe with the door closed and locked). b) The sequence in panel a, redrawn. Blue fields indicate coherent parts and subparts of the action sequence. At the coarsest level, the sequence breaks down into two parts, one organized around the subgoal of depositing the money, the other around the subgoal of locking the safe door. The action pick-up-key subserves both goals. Also indicated is a subordinate or nested sequence, organized around opening the safe door, c) One way of representing the sequence as a schema-, subtask- or subgoal hierarchy. Temporally abstract actions appear in blue.
Figure 2
Figure 2
a) Schematic of the coffee-making model from Cooper and Shallice. Filled circles: schema nodes. Bold labels: goal nodes. b) Activation of the schema nodes in the model from panel a, over the course of one task-completion episode. c) Schematic of the model from Botvinick and Plaut, showing only a subset of the units in each layer. Arrows indicate all-to-all connections. d) A two-dimensional representation of a series of internal representations arising in the Botvinick and Plaut model, generated using multidimensional scaling. Each point corresponds to a 50-dimensional pattern of activation across the network’s hidden units. Both traces are based on patterns arising during performance of the sugar-adding subtask (o = first action, locate-sugar; x = final action, stir). The solid trajectory shows patterns arising when the sequence was performed as part of coffee-making, the dashed trajectory when it was performed as part of another task: tea-making. The resemblance between the two trajectories reflects the fact that the sugar-adding subtask involves the same sequence of stimuli and responses, across the two contexts. The difference between trajectories reflects the fact that the model’s internal units maintain information about the overall task context, throughout the course of this subtask.
Figure 3
Figure 3
a) A schematic of action selection in the options framework. On the first time-step, a primitive action, A1, is selected. On time-step two, an option, O1, is selected, and this option’s policy leads to selection of a primitive action, A2, followed by selection of another option, O2. The policy for O2, in turn, selects primitive actions A3 and A4. The options then terminate, and another primitive action, A5, is selected at the topmost level. b) Inset: The rooms domain from Sutton, Precup and Singh, as implemented by Botvinick, Niv and Barto. S: start. G: goal. Primitive actions include single-step moves in the eight cardinal directions. Options contain polices to reach each door. Arrows show a sample trajectory, involving selection of two options (red and blue arrows) and three primitive actions (black). The plot shows the mean number of steps required to reach the goal, over learning episodes with and without inclusion of the door options. c: An actor-critic implementation of HRL, from Botvinick, Niv and Barto. Standard elements are the actor, which implements the policy (π), and the critic, which stores state-values (V), monitors rewards (R), computes reward-prediction errors (δ) and drives learning (see Sutton & Barto55). To these is added a new component serving to represent the currently active option (o), which impacts the operation of both actor and critic. d) Neural correlates of the elements in (c), as proposed by Botvinick, Niv and Barto. DA: dopamine; DLPFC+: dorsolateral prefrontal cortex, plus other frontal structures potentially including premotor, supplementary motor and presupplementary motor cortices; DLS: dorsolateral striatum; HT+: hypothalamus and other structures, potentially including the habenula, the pedunculopontine nucleus, and the superior colliculus; OFC: orbitofrontal cortex; VS: ventral striatum.
Figure 4
Figure 4
a) The position of the DLPFC within a hierarchy of cortical areas, as described by Fuster. b) Levels of control represented in different sectors of frontal cortex, according to Koechlin. Representations become progressively more abstract as one moves rostrally. c) The hierarchically structured network studied by Botvinick, showing only a subset of units in each layer. Arrows indicate all-to-all connections. When trained on a hierarchically structured task, units in the apical group spontaneously came to represent context information more strongly than did groups further down the hierarchy. d) Schematic of the gating model proposed by O’Reilly and Frank, during performance of a task requiring maintenance of the stimuli 1 and A in working memory. At the point shown, a 1 has already occurred, and has been gated into a prefrontal (PFC) stripe via a pathway through the striatum, substantia nigra (SNr) and thalamus (thal). At the moment shown, an A stimulus occurs (Stim) and is gated into another PFC stripe. Two levels of context are thus represented. e) Koechlin’s model of FPC function. Orbitofrontal cortex (Ofc) encodes the incentive value of various tasks. When two tasks are both associated with a high incentive value, the one with the highest value is selected within lateral prefrontal cortex (Lpc) for execution, while the runner-up is held in a pending state by the frontopolar cortex (Fpc).

References

    1. Lashley KS. The problem of serial order in behavior. In: Jeffress LA, editor. Cerebral mechanisms in behavior: The Hixon symposium. Wiley; 1951. pp. 112–136.
    1. Miller GA, et al. Plans and the structure of behavior. Holt, Rinehart & Winston; 1960.
    1. Schneider DW, Logan GD. Hierarchical control of cognitive processes: switching tasks in sequences. Journal of Experimental Psychology: General. 2006;135:623–640. - PubMed
    1. Kurby CA, Zacks JM. Segmentation in the perception and memory of events. Trends in Cognitive Sciences. 2008;12:72–79. - PMC - PubMed
    1. Saffran JR, Wilson DP. From syllables to syntax: multilevel statistical learning by 12-month-old infants. Infancy. 2003;4:273–284.