. 2008 May 31;161(3):273-80.
doi: 10.1016/j.resp.2008.03.001. Epub 2008 Mar 13.

Monotone Signal Segments Analysis as a novel method of breath detection and breath-to-breath interval analysis in rat

Affiliations

Monotone Signal Segments Analysis as a novel method of breath detection and breath-to-breath interval analysis in rat

Tijana Bojic et al. Respir Physiol Neurobiol. .

Abstract

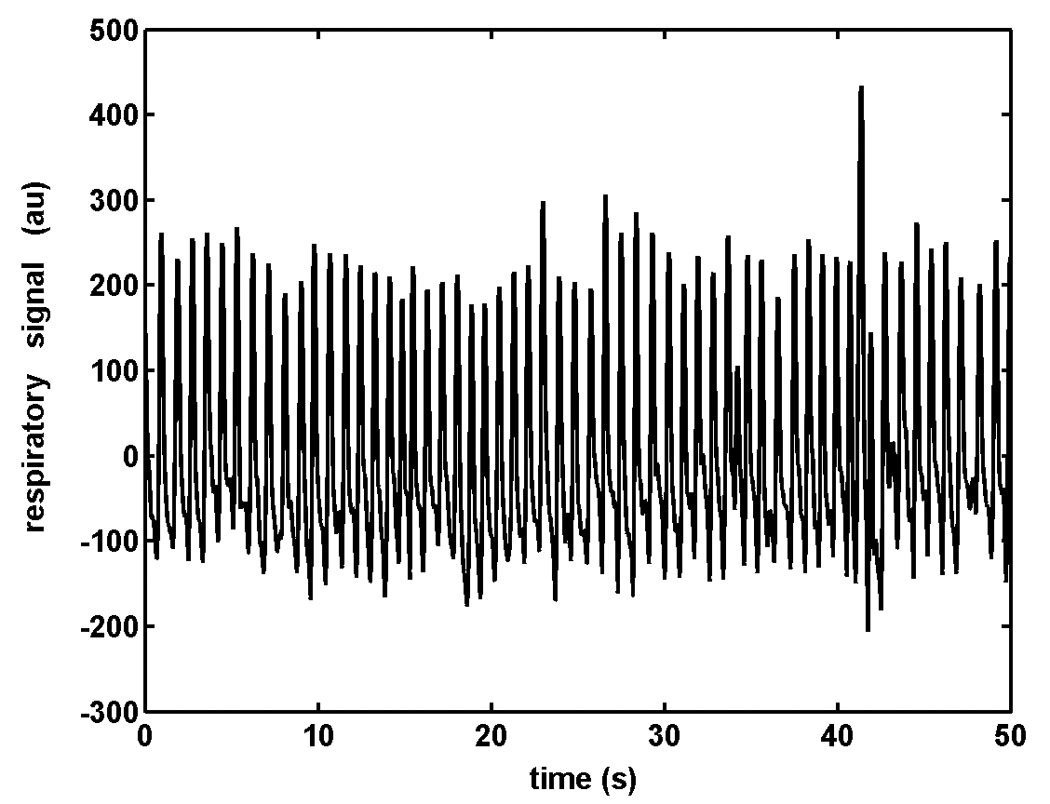
We applied a novel approach to respiratory waveform analysis--Monotone Signal Segments Analysis (MSSA) on 6-h recordings of respiratory signals in rats. To validate MSSA as a respiratory signal analysis tool we tested it by detecting: breaths and breath-to-breath intervals; respiratory timing and volume modes; and changes in respiratory pattern caused by lesions of monoaminergic systems in rats. MSSA differentiated three respiratory timing (tachypneic, eupneic, bradypneic-apneic), and three volume (artifacts, normovolemic, hypervolemic-sighs) modes. Lesion-induced respiratory pattern modulation was visible as shifts in the distributions of monotone signal segment amplitudes, and of breath-to-breath intervals. Specifically, noradrenergic lesion induced an increase in mean volume (p<or=0.03), with no change of the mean breath-to-breath interval duration (p>or=0.06). MSSA of timing modes detected noradrenergic lesion-induced interdependent changes in the balance of eupneic (decrease; p<or=0.02), and tachypneic (an increase; p<or=0.02) breath intervals with respect to control. In terms of breath durations within each timing mode, there was a tendency toward prolongation of the eupneic (p<or=0.08) and bradypneic-apneic (p<or=0.06) intervals. These results demonstrate that MSSA is sensitive to subtle shifts in respiratory rhythmogenesis not detectable by simple respiratory pattern descriptive statistics. MSSA represents a potentially valuable new tool for investigations of respiratory pattern control.


Figures

Fig. 1
Fig. 1
Respiratory signal, obtained as output from the plethysmograph, recorded from a rat following saline injection (control). The presence of low frequency oscillations can be visually appreciated. au - arbitrary units.
Fig. 2
Fig. 2
An expanded segment of the respiratory signal illustrated in Fig. 1, depicting the characteristic mss+/− (monotone signal segments) quantitative properties: h(mss1+),h(mss2) - heights of the first positive and second negative mss, respectively; d(mss1+),d(mss2) - durations of the respective mss; (Tb)1, (Tb)2 — breath-to-breath (BB) intervals; au - arbitrary units.
Fig. 3
Fig. 3
A. A typical distribution histogram presenting the number of monotone respiratory signal segments N(h(mss+/−), distributed by their heights, during a 6 h of recording in rat under control conditions. Positive and negative breathing peaks, Nb and Nb-, and one formed by non-respiratory, artifactual small height mss, Na, are marked separately. Limit between Na and Nb is pointed by a down arrow. Insert: Magnified part of the right side of Nb, visualising the presence of sighs. B. Histogram of the number of BB intervals, N(Tb), by their duration, Tb. Three modes within the respiratory pattern (N(Tb)) distribution are marked as: Ne (eupneic), Nt (tachypneic) and Nba (bradypneic-apneic). Insert: Magnified part of Nba, visualising the presence of bradypneic-apneic intervals.
Fig. 4
Fig. 4
A. Distribution of the square root of logarithms of monotone signal segments numbers, sqrt(log(N(h(mss+))), by their respective heights, h(mss+). Three volume modes within this respiratory pattern distribution are marked as: Na (artifacts), Nn (normovolemic) and Nhs (hypervolemic breaths and sighs). In the Nhs region, points leave the linear trend of Nn, indicated by a dashed line, positioned at the hypervolemic side of Nn (data from Fig. 3A). B. Distribution of the square root of logarithms of BB intervals numbers, sqrt(log(N(Tb))), by their respective interval durations, Tb (data from Fig. 3B). Three timing modes are marked as: Nt (tachypneic), Ne (eupneic) and Nba (bradypneic-apneic). In the Nba region, points leave the linear trend of Ne, indicated by a dashed line, positioned at the bradypneic side of Ne.
Fig. 5
Fig. 5
Examples of the verification results that histogram components Nt, Ne and Nba from Fig. 4 consist of tachypneic (A), eupneic (B) and bradypneic-apneic (C) BB intervals, respectively. Identified intervals are marked by horizontal dashed lines. au -arbitrary units.
Fig. 6
Fig. 6
Example of the relationship between breathing volume and BB interval shifts in two noradrenergic lesioned animals (A and B). Greater shift in breathing volumes (A1) was coupled with no shift in BB intervals (A2); small shift in volumes (B1) was observed together with a greater shift in BB intervals (B2). Bold line — lesion, thin line — control.
Fig. 7
Fig. 7
(A) Typical bimodal histograms of monotone respiratory signal segments N(h(mss+) heights (thick line); and local maximums by their values (thin line), in a case or stable respiratory baseline throughout a 6-h recording (insert). (B) Distributions of the number of BB intervals (N(Tb)) by their durations (Tb) obtained by MSSA (thick line) and by the threshold crossing method (thin line).
Fig. 8
Fig. 8
The bimodal histogram of monotone respiratory signal segments N(h(mss+) by their heights (thick line); and the tri-modal histogram of local maximums by their values (thin line), in a case of unstable respiratory baseline during a 6-h recording (insert).

References

    1. Benchetrit G. Breathing pattern in humans: diversity and individuality. Respir Physiol. 2000;122:123–129. - PubMed
    1. Bertinieri G, di Rienzo M, Cavalazzi A, Ferrari AU, Pedotti A, Mancia G. Evaluation of baroreceptor reflex by blood pressure monitoring in unanesthetized cats. Am J Physiol. 1988;254:H377–H383. - PubMed
    1. Carley DW. Minimal modeling of hyman respiratory stability. In: Khoo M, editor. Modeling and parameter estimation in respiratory control. NY: Plenum Press; 1989. pp. 171–180.
    1. Carley DW, Maayan C, Grimes J, Shannon DC. Breath-by-breath respiratory timing and volume control during periodic breathing. Am J Physiol. 1989;257:R653–R660. - PubMed
    1. Carley DW, Radulovacki M. Mirtazapine, a mixed-profile serotonin agonist/antagonist, suppresses sleep apnea in the rat. Am J Respir Crit Care Med. 1999;160:1824–1829. - PubMed

Publication types