. 2008 Jun 27;283(26):18365-76.
doi: 10.1074/jbc.M710466200. Epub 2008 Apr 17.

Targeted ablation of glucose-dependent insulinotropic polypeptide-producing cells in transgenic mice reduces obesity and insulin resistance induced by a high fat diet

Affiliations

Targeted ablation of glucose-dependent insulinotropic polypeptide-producing cells in transgenic mice reduces obesity and insulin resistance induced by a high fat diet

Matthew C Althage et al. J Biol Chem. .

Abstract

The K cell is a specific sub-type of enteroendocrine cell located in the proximal small intestine that produces glucose-dependent insulinotropic polypeptide (GIP), xenin, and potentially other unknown hormones. Because GIP promotes weight gain and insulin resistance, reducing hormone release from K cells could lead to weight loss and increased insulin sensitivity. However, the consequences of coordinately reducing circulating levels of all K cell-derived hormones are unknown. To reduce the number of functioning K cells, regulatory elements from the rat GIP promoter/gene were used to express an attenuated diphtheria toxin A chain in transgenic mice. K cell number, GIP transcripts, and plasma GIP levels were profoundly reduced in the GIP/DT transgenic mice. Other enteroendocrine cell types were not ablated. Food intake, body weight, and blood glucose levels in response to insulin or intraperitoneal glucose were similar in control and GIP/DT mice fed standard chow. In contrast to single or double incretin receptor knock-out mice, the incretin response was absent in GIP/DT animals suggesting K cells produce GIP plus an additional incretin hormone. Following high fat feeding for 21-35 weeks, the incretin response was partially restored in GIP/DT mice. Transgenic versus wild-type mice demonstrated significantly reduced body weight (25%), plasma leptin levels (77%), and daily food intake (16%) plus enhanced energy expenditure (10%) and insulin sensitivity. Regardless of diet, long term glucose homeostasis was not grossly perturbed in the transgenic animals. In conclusion, studies using GIP/DT mice demonstrate an important role for K cells in the regulation of body weight and insulin sensitivity.


Figures

FIGURE 1.
FIGURE 1.
Design of transgenic constructs. A fragment containing the GIP promoter through the NcoI site within the initiator methionine in exon 2 of the GIP structural gene was isolated and fused in-frame to the initiator methionine encoding RFP. A second intron, a splice site, and polyadenylation signals are present in the 3′-UTR from SV40 Large T antigen. The resulting GIP/RFP construct encodes a chimeric mRNA transcript but not a chimeric RFP protein. Colors represent the GIP promoter (dark blue); exonic (Ex) sequences from the GIP gene (black), intron 1 (In1) from the GIP gene (gray), RFP cDNA (red), the SV40 3′-UTR (light blue). To generate the GIP/DT construct, an NcoI fragment from the RFP cDNA was replaced with an NcoI fragment encoding the DT cDNA (green). The attenuated diphtheria toxin A chain without any additional amino acids was generated from the chimeric transcript.
FIGURE 2.
FIGURE 2.
Novel regulatory sequences from the rat GIP promoter and structural gene confer proper transgene expression in vivo. RNA was isolated from the indicated tissue from GIP/RFP mice and assayed for GIP and RFP using real-time PCR. Values are relative to those in the most proximal 2 cm of small intestine (SI-Prox). Note that, like the endogenous GIP gene, RFP is expressed at high levels in the proximal small intestine and at much lower levels in the stomach and the most distal 2-cm of the small intestine (SI-Dist). Expression in the first 2 cm of colon is 50-fold less than that in the proximal small intestine. GIP and RFP transcripts were not expressed at detectable levels in the submandibular salivary (Sal) gland.
FIGURE 3.
FIGURE 3.
GIP/RFP transgene expression is confined to GIP-producing cells in the intestinal epithelium. A single paraffin-embedded section from a GIP/RFP mouse intestine was stained with antibodies to RFP (red) plus GIP (green). Nuclei were counterstained blue. Each fluorescent dye was photographed as a single color and then overlaid in Adobe Photoshop to generate a merged image. Note that high levels of GIP and RFP are expressed in the same scattered, rare cells in the intestinal epithelium (open arrows). Low levels of both RFP and GIP can also be seen in a third cell (solid arrow). RFP staining was not observed in sections prepared from the intestines from wild-type mice.
FIGURE 4.
FIGURE 4.
Transcripts encoding GIP, but not other EE cell products, are greatly reduced in GIP/DT mice. RNA was isolated from the stomach, from the mid-portion of sequential segments of the small intestine (SI-1 to SI-5 (see A)) and from the pancreas. Liver served as a negative control. Real-time PCR was used to quantify the mRNA levels for the indicated transcript. Note that GIP mRNA levels are nearly absent in the GIP/DT (DT) mice, whereas transcripts that encode all other products are essentially normal. Results represent the average from four wild-type (WT) and four GIP/DT mice.
FIGURE 5.
FIGURE 5.
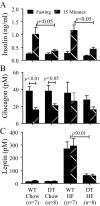
The incretin effect is absent in mice lacking GIP-producing cells. Wild-type (WT) and GIP/DT (DT) mice fed standard chow (Chow) or high fat food (HF) for 15 weeks were fasted for 16 h. Plasma hormone levels were determined on the same samples before and 15 min after administration of glucose (3 mg/g body weight) by intragastric gavage. A, note that oral glucose-stimulated insulin release is essentially absent in the GIP/DT mice fed standard chow but is partially restored following high fat feeding. B, note that glucagon levels and responses are similar in wild-type and GIP/DT mice. C, note that GIP/DT mice fed high fat diet produce much less leptin than wild-type animals. It should be noted that leptin levels reflect adipose mass and are not increased by acute ingestion of nutrients. Thus, the 0- and 15-min values represent duplicates.
FIGURE 6.
FIGURE 6.
Exogenous GLP-1 increases glucose clearance from blood in mice lacking GIP-producing cells. Wild-type (WT) and GIP/DT (DT) mice were fasted overnight. Blood glucose levels were measured before (0 min) and at the indicated time after intraperitoneal administration of glucose (1 mg/g body weight) with (+) or without (-) 1 nmol of synthetic GLP-1-(7-36 amide). Note that GLP-1 potentiated glucose clearance to similar extents in wild-type and GIP/DT mice.
FIGURE 7.
FIGURE 7.
GIP/DT mice resist development of high fat diet-induced obesity. At 8 weeks of age, groups of mice were either switched to the high fat (HF) diet or maintained on standard chow (Chow). Body weights were determined at the indicated time after commencing the high fat diet. Note that wild-type (WT) mice fed a high fat diet weigh 55% more than those maintained on standard chow. Conversely, high fat feeding promoted only an 11% gain in body weight of the GIP/DT animals.
FIGURE 8.
FIGURE 8.
High fat food intake is reduced in mice lacking GIP-producing cells. Food intake per mouse was measured in individually housed, well acclimated wild-type (WT) and GIP/DT (DT) mice fed standard chow or a HF diet for 21 weeks. Values represent the amount of food consumed per 24 h and are the average from 5 consecutive days. Note that, on the HF diet, the transgenic animals eat ∼16% less HF food per day.
FIGURE 9.
FIGURE 9.
Energy expenditure is reduced in mice lacking GIP-producing cells fed a high fat diet. Following 13 weeks of high fat feeding, wild-type (black) and GIP/DT (red) mice were placed in the PhysioScan chamber, and energy expenditure was recorded for 24 h. Black and white bars represent dark and light cycles, respectively. Insets show the area under the curve for oxygen consumption (VO2), carbon dioxide production (VCO2), respiration quotient, and heat output. Note that energy expenditure is increased in GIP/DT mice during the dark cycle. Similar results were observed in fasted animals.
FIGURE 10.
FIGURE 10.
Insulin sensitivity is improved in GIP/DT mice fed a high fat diet. A and B, insulin tolerance tests (ITT): wild-type (WT) and GIP/DT (DT) mice fed standard chow (Chow; Panel A) or high fat food (HF; Panel B) for 33 weeks were fasted for 5 h and then administered human insulin by intraperitoneal injection (0.5 unit/kg body weight). Blood glucose levels were determined before (0 min) and at the indicated time following administration of insulin. Note that glucose clearance rates from blood are identical in wild-type and GIP/DT mice fed standard chow, whereas insulin sensitivity is greatest in GIP/DT mice fed high fat food. C-E, insulin to glucose ratios: mice were maintained on standard chow or high fat food for 27 weeks. Blood was then collected from non-fasted wild-type and GIP/DT mice between 10 a.m. and noon (C). Blood glucose and plasma insulin levels are shown in C and D, respectively. The insulin to glucose ratio (E) was calculated using glucose and insulin values from individual mice. Note that insulin levels and insulin to glucose ratios are elevated only in wild-type mice fed a high fat diet indicating that wild-type, but not GIP/DT mice, are insulin resistant.
FIGURE 11.
FIGURE 11.
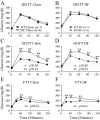
Glucose homeostasis is similar in wild-type (WT) and GIP/DT (DT) mice. Mice were fasted for 16 h. Blood glucose levels were determined before (time 0) and at the indicated time after animals were given intraperitoneal glucose (1 mg/g body weight; IPGTT), oral glucose (3 mg/g body weight; OGTT), or free access to standard chow (Chow) or high fat (HF) food (FTT; panels E and F). A and B, note that on standard chow, the GIP/DT mice exhibited normal clearance of glucose from blood following administration of intraperitoneal glucose. Conversely, high fat feeding resulted in a similarly reduced rate of glucose clearance in both wild-type and GIP/DT mice compared with parallel groups on a standard chow diet. C and D, note that GIP/DT mice fed either standard chow or high fat food exhibited impaired glucose tolerance due to the lack of an incretin effect. However, high fat feeding worsened oral glucose tolerance only in the wild-type mice. E and F, note that, in contrast to administration of oral glucose, normal food intake results in only a modest increase in blood glucose levels. IPGTT, OGTT, and FTT were conducted following 30, 31, and 20 weeks, respectively, on a high fat diet.
FIGURE 12.
FIGURE 12.
Intraperitoneal glucose-stimulated insulin release is normal in mice lacking GIP-producing cells. Wild-type (WT) and GIP/DT (DT) mice were fasted for 16 h. Blood was collected at the indicated time before (Fasting) or after intraperitoneal injection of glucose (1 mg/g body weight).
FIGURE 13.
FIGURE 13.
Glucose clearance and insulin release are near normal following physiologic refeeding. Mice maintained on standard chow were treated as described in Fig. 11. Blood glucose and plasma insulin were determined before and at the indicated time after fasted mice were given free access to standard chow. Note that blood glucose levels are much lower following physiologic refeeding versus administration of a single high dose bolus of oral glucose. Comparison of glucose and insulin levels suggests that, even on standard chow, GIP/DT mice exhibited a slight increase in insulin sensitivity.
FIGURE 14.
FIGURE 14.
Long term glucose homeostasis is not perturbed in GIP/DT mice. HbA1c levels were determined in blood collected from wild-type (WT) and GIP/DT (DT) mice were fed standard chow (Chow) or high fat (HF) food for 36 weeks. Diabetic Akita mice on a C57BL/6J background served as positive control to confirm the validity of the assay. Note that HbA1c levels are similar in wild-type and GIP/DT mice fed standard chow and are elevated only 15% in the GIP/DT mice fed the high fat diet.

References

    1. Aiken, K. D., Kisslinger, J. A., and Roth, K. A. (1994) Dev. Dyn. 201 636-670 - PubMed
    1. Roth, K. A., and Gordon, J. I. (1990) Proc. Natl. Acad. Sci. 87 6408-6412 - PMC - PubMed
    1. Sjolund, K., Sanden, G., Hakanson, R., and Sundler, F. (1983) Gastroenterology 85 1120-1130 - PubMed
    1. Brand, S. J., and Schmidt, W. E. (1995) in Textbook of Gastroenterology (Yamada, T., ed) pp. 25-741, JB Lippincott Company, Philadelphia
    1. Walsh, J. H. (1994) in Physiology of the Gastrointestinal Tract (Johnson, L. R., ed) pp. 1-128, Raven Press, New York

Publication types