. 2008 Jun 15;586(12):2903-12.
doi: 10.1113/jphysiol.2008.151233. Epub 2008 Apr 17.

Presynaptic (Type III) cells in mouse taste buds sense sour (acid) taste

Affiliations

Presynaptic (Type III) cells in mouse taste buds sense sour (acid) taste

Yijen A Huang et al. J Physiol. .

Abstract

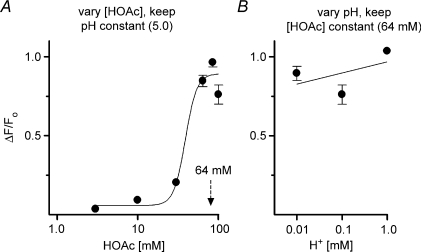
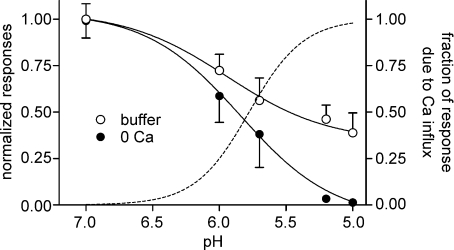
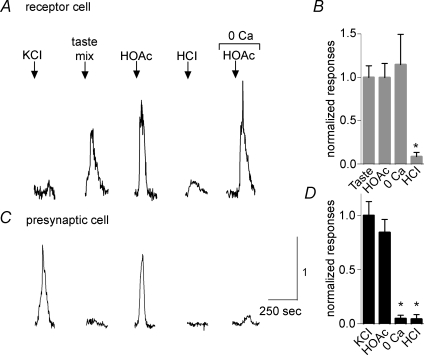
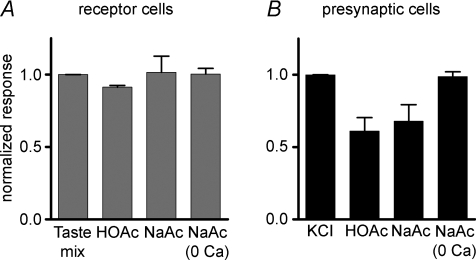
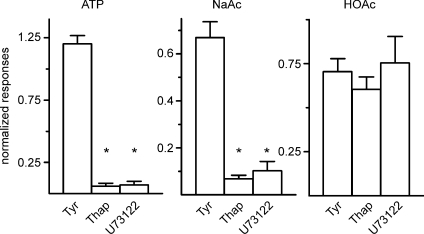
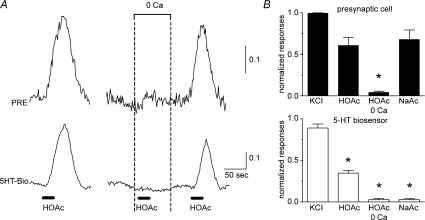
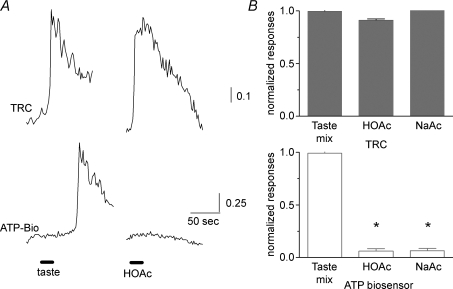
Taste buds contain two types of cells that directly participate in taste transduction - receptor (Type II) cells and presynaptic (Type III) cells. Receptor cells respond to sweet, bitter and umami taste stimulation but until recently the identity of cells that respond directly to sour (acid) tastants has only been inferred from recordings in situ, from behavioural studies, and from immunostaining for putative sour transduction molecules. Using calcium imaging on single isolated taste cells and with biosensor cells to identify neurotransmitter release, we show that presynaptic (Type III) cells specifically respond to acid taste stimulation and release serotonin. By recording responses in cells isolated from taste buds and in taste cells in lingual slices to acetic acid titrated to different acid levels (pH), we also show that the active stimulus for acid taste is the membrane-permeant, uncharged acetic acid moiety (CH(3)COOH), not free protons (H(+)). That observation is consistent with the proximate stimulus for acid taste being intracellular acidification, not extracellular protons per se. These findings may also have implications for other sensory receptors that respond to acids, such as nociceptors.


Figures

Figure 5
Figure 5. The amplitude of acid-evoked Ca2+ responses varies with [HOAc] but not with [H+] (i.e. pH)
Acetic acid solutions of varying pH and acid concentration were focally applied to the taste pore in the lingual slice preparation. Each data point is the mean ±s.e.m. (n = 3–22). A, responses evoked by acetic acid solutions of a constant [H+] (pH 5) but varying [HOAc] from 3 to 100 mm. B, responses obtained when [HOAc] was maintained at 64 mm but [H+] was varied from pH 5–3. (Note that this situation contrasts with the experiment shown in Fig. 4. In Fig. 4 the proportion of the protonated species in the stimulus, HOAc, was not maintained at a constant value but allowed to increase as the pH dropped, as per Henderson–Hasselbalch relations, see Methods.) The deviation of the slope from zero in B is not significant (P < 0.23) (r2= 0.20). These data indicate that acid taste responses vary with the concentration of the membrane-permeant acid (HOAc) but not with the membrane-impermeant proton (H+), supporting the interpretation that intracellular not extracellular acidification evokes sour taste.
Figure 4
Figure 4. Acetic acid taste stimulation of presynaptic (Type III) taste cells varies with pH
Symbols are means ±s.e.m. of Ca2+ responses evoked by 10 mm acetic acid titrated with 1 n NaOH to different pH levels (for example, acetic acid titrated to pH 7 is equivalent to sodium acetate). Left ordinate (continuous lines) data are normalized to Ca2+ responses evoked by 10 mm sodium acetate, pH 7.0. Responses were recorded from cells bathed in Tyrode buffer (○) and in buffer in which Ca2+ was replaced by equimolar Mg2+ (•) to determine the approximate proportion contributed by Ca2+ influx. The difference between responses with and without Ca2+ is plotted as a dashed line and normalized to responses at pH 7.0, thus showing the fraction of response that is due to Ca2+ influx (right ordinate). Each point represents data from 3–11 cells.
Figure 1
Figure 1. Acetic acid taste stimulation evokes Ca2+ responses in receptor (Type II) cells and presynaptic (Type III) cells
A, examples of receptor cell responses to bath applied KCl (50 mm), taste mix (10 μm cycloheximide, 2 mm saccharin, 1 mm denatonium and 0.1 mm SC45647), acetic acid (10 mm, pH 5), HCl (10 mm, pH 3), and acetic acid when Ca2+ in the bathing solution had been exchanged with Mg2+. B, summary of data for receptor cells. C, example of responses from a presynaptic cell to the same sequence of stimuli as in A. D, summary of data for presynaptic cells. In B and D, bars show Ca2+ response amplitudes (means ±s.e.m.). All responses were normalized to the (pooled) mean response to taste mix (receptor cells) or to KCl depolarization (presynaptic cells). Data in B and D are from 22 experiments (n = 32 cells). *P < 0.05. HOAc, acetic acid.
Figure 2
Figure 2. Intracellular acidification by sodium acetate evokes Ca2+ responses in receptor cells and in presynaptic cells
A, receptor cells: Ca2+ responses evoked by bath-applied taste mix (as in Fig. 1A), acetic acid (10 mm, pH 5), and sodium acetate (20 mm, pH 7.2). Bars show means ±s.e.m. of responses. Responses were normalized to the (pooled) mean response evoked by taste mix (n = 3). B, presynaptic cells: similarly, Ca2+ responses evoked by KCl depolarization, acetic acid and sodium acetate (n = 9). As in B, responses were normalized to the (pooled) mean response to KCl depolarization. HOAc, acetic acid; NaAc, sodium acetate.
Figure 3
Figure 3. Intracellular Ca2+ release in presynaptic (Type III) cells is via a phospholipase C-mediated pathway
Data show Ca2+ responses evoked by ATP (1 μm), sodium acetate (NaAc, 20 mm, pH 7) and acetic acid (HOAc, 10 mm, pH 5). ATP and NaAc stimulate intracellular Ca2+ release via P2Y receptor activation and cytosolic acidification, respectively (Fig. 1; see Slotki et al. 1993; Speake & Elliott, 1998). In constrast, HOAc elicits Ca2+ signals via Ca2+ influx (see Fig. 1C and D). Treating presynaptic cells with thapsigargin (1 μm) significantly reduced Ca2+ responses evoked by ATP and NaAc, consistent with Ca2+ store release mechanisms for these stimuli. However, thapsigargin did not significantly alter HOAc-evoked Ca2+ responses, as expected for acid-stimulated Ca2+ influx. U73122 (5 μm) reduced Ca2+ signals stimulated by ATP and NaAc, but not by HOAc, suggesting that intracellular Ca2+ store release initiated by ATP or NaAc involves a phospholipase C. Bars show mean amplitudes ±s.e.m. of responses. Responses are normalized to the (pooled) mean response to KCl depolarization in the same cells (ATP, n = 8; NaAc, n = 10; HOAc, n = 10). Abbreviations: Tyr, Tyrode buffer; Thap, thapsigargin; NaAc, sodium acetate; HOAc, acetic acid. *P < 0.05
Figure 6
Figure 6. Acid taste stimulation evokes 5-HT release from presynaptic (Type III) taste cells
A, recording of Ca2+ responses in a presynaptic cell (PRE) and from a closely apposed 5-HT biosensor cell (5-HT Bio). Bath-applied acetic acid (HOAc, bar at bottom of traces, 10 mm, pH 5.0) evoked Ca2+ responses in the presynaptic cell (top trace) and, after a brief delay, in the biosensor cell (bottom trace), indicating 5-HT secretion. Responses in the presynaptic and 5-HT biosensor cells alike were abolished when Ca2+ was replaced with Mg2+ in the bathing solution (0 Ca, dashed lines). B, summary of data. Bars represent means ±s.e.m. of individual responses. All responses were normalized to the (pooled) mean KCl response for all experiments in the series (n = 11). Filled bars, data from presynaptic cells. Open bars, corresponding data from the apposed 5-HT biosensor cells. *P < 0.05
Figure 7
Figure 7. Acid taste stimulation does not evoke ATP secretion from receptor (Type II) cells
A, Ca2+ responses in a taste receptor cell (TRC) and from an apposed ATP biosensor cell (ATP-Bio). Bath-applied taste mix and acetic acid (10 mm, pH 5.0) (bars at bottom of traces) evoked Ca2+ responses in the receptor cell (top traces). However, only taste stimulation led to a response from the biosensor cell, indicating ATP secretion (bottom trace). B, summary of data. Bars represent means ±s.e.m. normalized to responses evoked by taste mix (n = 4). Filled bars, responses from receptor cells. Open bars, corresponding results from the adjacent ATP biosensor. *P < 0.05.

Comment in

References

    1. Caicedo A, Jafri MS, Roper SD. In situ Ca2+ imaging reveals neurotransmitter receptors for glutamate in taste receptor cells. J Neurosci. 2000;20:7978–7985. - PMC - PubMed
    1. Caicedo A, Kim KN, Roper SD. Individual mouse taste cells respond to multiple chemical stimuli. J Physiol. 2002;544:501–509. - PMC - PubMed
    1. Clapp TR, Yang R, Stoick CL, Kinnamon SC, Kinnamon JC. Morphologic characterization of rat taste receptor cells that express components of the phospholipase C signaling pathway. J Comp Neurol. 2004;468:311–321. - PubMed
    1. DeFazio RA, Dvoryanchikov G, Maruyama Y, Kim JW, Pereira E, Roper SD, Chaudhari N. Separate populations of receptor cells and presynaptic cells in mouse taste buds. J Neurosci. 2006;26:3971–3980. - PMC - PubMed
    1. Gilbertson TA, Damak S, Margolskee RF. The molecular physiology of taste transduction. Curr Opin Neurobiol. 2000;10:519–527. - PubMed

Publication types

Substances

LinkOut - more resources