

Tissue-specific actions of the Ept1, Ept2, Ept6, and Ept9 genetic determinants of responsiveness to estrogens in the female rat
- PMID: 18420736
- PMCID: PMC2488241
- DOI: 10.1210/en.2008-0173
Tissue-specific actions of the Ept1, Ept2, Ept6, and Ept9 genetic determinants of responsiveness to estrogens in the female rat
Abstract
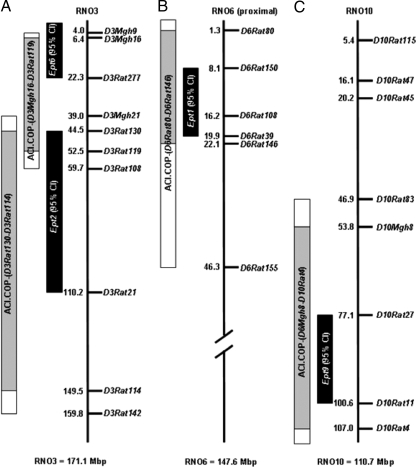
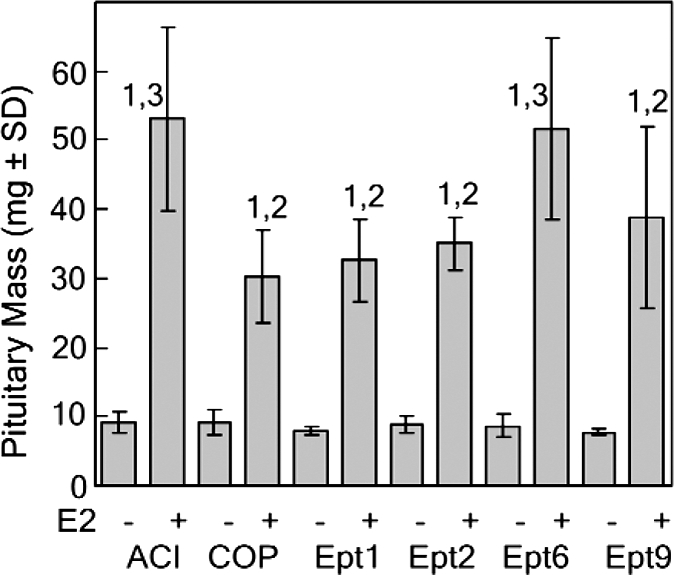
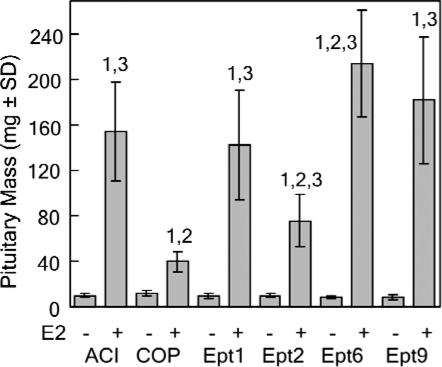
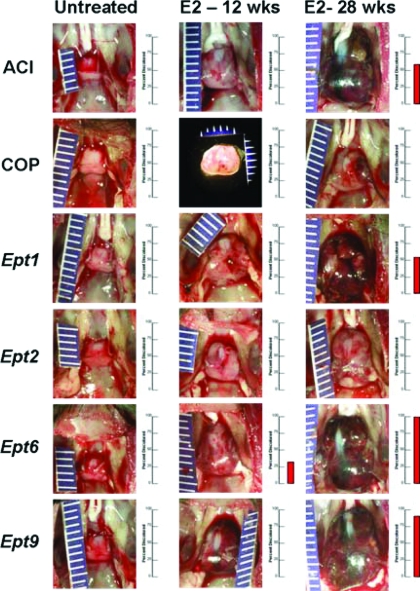
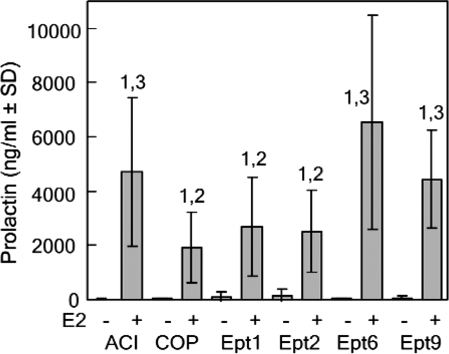
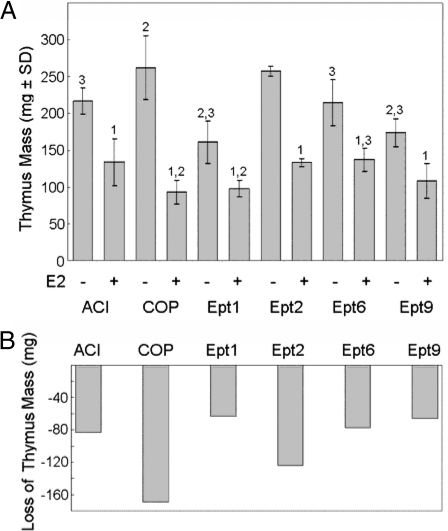
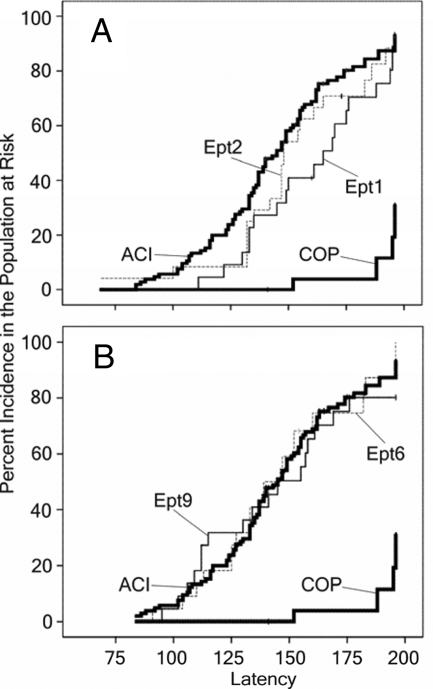
Ept1, Ept2, Ept6, and Ept9 are quantitative trait loci mapped in crosses between the ACI and Copenhagen (COP) rat strains as genetic determinants of responsiveness of the pituitary gland to estrogens. We have developed four congenic rat strains, each of which carries, on the genetic background of the ACI rat strain, alleles from the COP rat strain that span one of these quantitative trait loci. Relative to the female ACI rats, female ACI.COP-Ept1 rats exhibited reduced responsiveness to 17beta-estradiol (E2) in the pituitary gland, as evidenced by quantification of pituitary mass and circulating prolactin, and in the mammary gland, as evidenced by reduced susceptibility to E2-induced mammary cancer. The ACI.COP-Ept2 rat strain exhibited reduced responsiveness to E2 in the pituitary gland but did not differ from the ACI strain in regard to susceptibility to E2-induced mammary cancer. Interestingly, female Ept2 congenic rats exhibited increased responsiveness to E2 in the thymus, as evidenced by enhanced thymic atrophy. The ACI.COP-Ept6 rat strain exhibited increased responsiveness to E2 in the pituitary gland, which was associated with a qualitative phenotype suggestive of enhanced pituitary vascularization. The ACI.COP-Ept9 rat strain exhibited reduced responsiveness to E2 in the anterior pituitary gland, relative to the ACI rat strain. Neither Ept6 nor Ept9 impacted responsiveness to E2 in the mammary gland or thymus. These data indicate that each of these Ept genetic determinants of estrogen action is unique in regard to the tissues in which it exerts its effects and/or the direction of its effect on estrogen responsiveness.
Figures
Similar articles
-
Genetic bases of estrogen-induced pituitary tumorigenesis: identification of genetic loci determining estrogen-induced pituitary growth in reciprocal crosses between the ACI and Copenhagen rat strains.Genetics. 2005 Apr;169(4):2189-97. doi: 10.1534/genetics.104.039370. Epub 2005 Jan 31. Genetics. 2005. PMID: 15687265 Free PMC article.
-
Rat strain-specific actions of 17beta-estradiol in the mammary gland: correlation between estrogen-induced lobuloalveolar hyperplasia and susceptibility to estrogen-induced mammary cancers.Proc Natl Acad Sci U S A. 2000 Mar 14;97(6):2779-84. doi: 10.1073/pnas.050569097. Proc Natl Acad Sci U S A. 2000. PMID: 10688907 Free PMC article.
-
Susceptibility to estrogen-induced mammary cancer segregates as an incompletely dominant phenotype in reciprocal crosses between the ACI and Copenhagen rat strains.Endocrinology. 2001 Dec;142(12):5124-30. doi: 10.1210/endo.142.12.8530. Endocrinology. 2001. PMID: 11713205
-
Rat models of 17β-estradiol-induced mammary cancer reveal novel insights into breast cancer etiology and prevention.Physiol Genomics. 2018 Mar 1;50(3):215-234. doi: 10.1152/physiolgenomics.00105.2017. Epub 2018 Jan 26. Physiol Genomics. 2018. PMID: 29373076 Free PMC article. Review.
-
Estrogen action in the regulation of cell proliferation, cell survival, and tumorigenesis in the rat anterior pituitary gland.Endocrine. 1999 Dec;11(3):217-33. doi: 10.1385/ENDO:11:3:217. Endocrine. 1999. PMID: 10786818 Review.
Cited by
-
Tocopherols inhibit oxidative and nitrosative stress in estrogen-induced early mammary hyperplasia in ACI rats.Mol Carcinog. 2015 Sep;54(9):916-25. doi: 10.1002/mc.22164. Epub 2014 Apr 30. Mol Carcinog. 2015. PMID: 24782330 Free PMC article.
-
Dietary tocopherols inhibit cell proliferation, regulate expression of ERα, PPARγ, and Nrf2, and decrease serum inflammatory markers during the development of mammary hyperplasia.Mol Carcinog. 2013 Jul;52(7):514-25. doi: 10.1002/mc.21886. Epub 2012 Mar 2. Mol Carcinog. 2013. PMID: 22389237 Free PMC article.
-
CXM: a new tool for mapping breast cancer risk in the tumor microenvironment.Cancer Res. 2014 Nov 15;74(22):6419-29. doi: 10.1158/0008-5472.CAN-13-3212. Epub 2014 Aug 29. Cancer Res. 2014. PMID: 25172839 Free PMC article.
-
Berries and ellagic acid prevent estrogen-induced mammary tumorigenesis by modulating enzymes of estrogen metabolism.Cancer Prev Res (Phila). 2010 Jun;3(6):727-37. doi: 10.1158/1940-6207.CAPR-09-0260. Epub 2010 May 25. Cancer Prev Res (Phila). 2010. PMID: 20501861 Free PMC article.
-
Dietary γ-Tocopherol-Rich Mixture Inhibits Estrogen-Induced Mammary Tumorigenesis by Modulating Estrogen Metabolism, Antioxidant Response, and PPARγ.Cancer Prev Res (Phila). 2015 Sep;8(9):807-16. doi: 10.1158/1940-6207.CAPR-15-0154. Epub 2015 Jun 30. Cancer Prev Res (Phila). 2015. PMID: 26130252 Free PMC article.
References
-
- Sarkar DK, Hentges ST, De A, Reddy RH 1998 Hormonal control of pituitary prolactin-secreting tumors. Front Biosci 3:d934–d943 - PubMed
-
- Gorski J, Wendell D, Gregg D, Chun TY 1997 Estrogens and the genetic control of tumor growth. Prog Clin Biol Res 396:233–243 - PubMed
-
- Spady TJ, McComb RD, Shull JD 1999 Estrogen action in the regulation of cell proliferation, cell survival, and tumorigenesis in the rat anterior pituitary gland. Endocrine 11:217–233 - PubMed
-
- Wiklund J, Wertz N, Gorski J 1981 A comparison of estrogen effects on uterine and pituitary growth and prolactin synthesis in F344 and Holtzman rats. Endocrinology 109:1700–1707 - PubMed
