. 2008 Apr 18;4(4):e1000065.
doi: 10.1371/journal.pcbi.1000065.

Functional maps of protein complexes from quantitative genetic interaction data

Affiliations

Functional maps of protein complexes from quantitative genetic interaction data

Sourav Bandyopadhyay et al. PLoS Comput Biol. .

Abstract

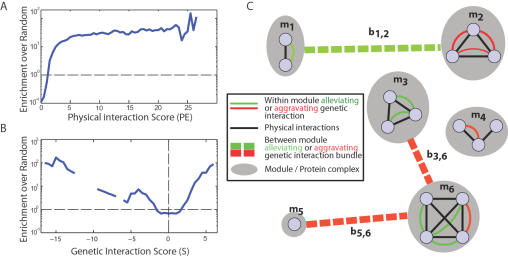
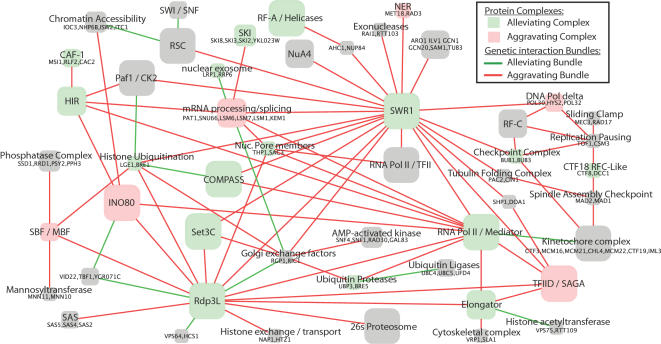
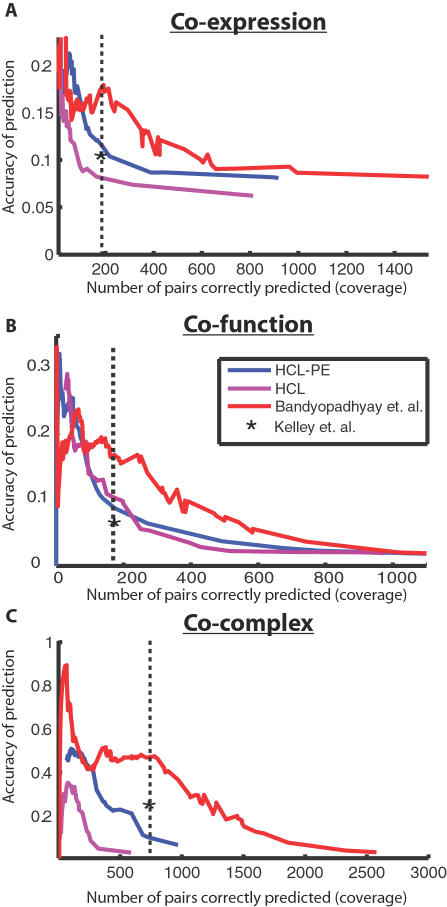
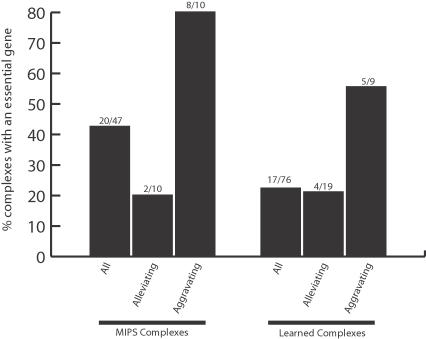
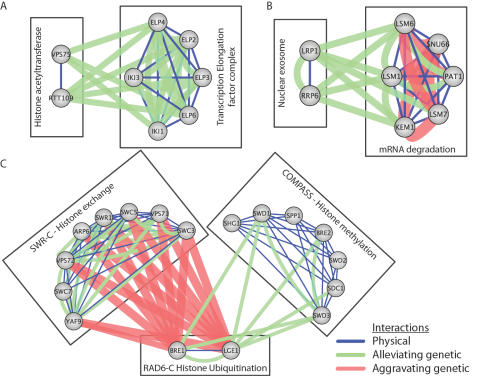
Recently, a number of advanced screening technologies have allowed for the comprehensive quantification of aggravating and alleviating genetic interactions among gene pairs. In parallel, TAP-MS studies (tandem affinity purification followed by mass spectroscopy) have been successful at identifying physical protein interactions that can indicate proteins participating in the same molecular complex. Here, we propose a method for the joint learning of protein complexes and their functional relationships by integration of quantitative genetic interactions and TAP-MS data. Using 3 independent benchmark datasets, we demonstrate that this method is >50% more accurate at identifying functionally related protein pairs than previous approaches. Application to genes involved in yeast chromosome organization identifies a functional map of 91 multimeric complexes, a number of which are novel or have been substantially expanded by addition of new subunits. Interestingly, we find that complexes that are enriched for aggravating genetic interactions (i.e., synthetic lethality) are more likely to contain essential genes, linking each of these interactions to an underlying mechanism. These results demonstrate the importance of both large-scale genetic and physical interaction data in mapping pathway architecture and function.


Conflict of interest statement

The authors have declared that no competing interests exist.

Figures

Figure 1
Figure 1. Combining physical and genetic interactions to define protein complexes.
Correspondence of the physical interaction score (A) and the genetic interaction score (B) with the known small-scale, manually annotated protein complexes in MIPS. To compute the enrichment over random (y-axis), one first computes the fraction f of interactions at each score x that fall inside a MIPS small-scale complex (bin size of 1.5). The enrichment is the ratio f/r, where r is the fraction of random protein pairs within MIPS complexes. (C) Proteins are grouped into physically interacting sets called modules (gray ovals; m 1m 6). Pairs of modules may be linked to indicate a functional relationship (dotted lines; b 1b 6). The assignment of proteins to modules along with the list of inter-module links comprises the state of the system.
Figure 2
Figure 2. Global map of protein complexes involved in yeast chromosome biology.
Each node represents a predicted multimeric protein complex, while each link represents a significantly alleviating or aggravating bundle of genetic interactions between complexes, indicative of an inter-complex functional relationship. Node colors indicate enrichment for alleviating or aggravating genetic interactions among members of the same complex. Node sizes are proportional to the number of proteins in the complex. When known, nodes are labeled with the common name of the complex. For complexes that are newly identified by our study and thus unnamed, the constituent proteins are listed. For clarity, the co-chaperone prefoldin complex (PFD1, PAC10, YKE2, GIM3, GIM4, GIM5, BUD27) and the 25 links associated with it have been removed.
Figure 3
Figure 3. Performance of complex identification.
The proposed approach is compared to several competing methods of discovering protein complexes within genetic interaction networks: HCL implements hierarchical clustering with a distance measure computed from the genetic interaction profiles only (S-scores), while HCL-PE extends HCL by merging clusters only if there is a physical interaction between them (PE-score>1). For the modules defined by each method, accuracy versus coverage is plotted over a range of values for tuning the module size (see Methods). Accuracy is estimated as the fraction of protein pairs in a predicted module that are in a gold-standard set; coverage is estimated as the number of gold-standard pairs that fall in the same predicted module. Gold-standard sets are defined by protein pairs that are either (A) co-expressed, (B) functionally-related, or (C) assigned to the same complex in high-throughput data sets (as annotated in MIPS). The performance at the chosen parameter setting (α = 1.6) is indicated by the dotted vertical line. The performance of the method of Kelley et al. is reported for the same level of coverage as the present approach (asterisk). Since it operates on binary interaction data, we converted quantitative genetic and physical interaction scores to binary values based on a threshold of |S|>2.5 and PE>1.
Figure 4
Figure 4. Aggravating complexes are more likely to contain essential genes.
The percentage of complexes that contain at least one essential gene is shown, for various groups of complexes defined within small-scale complexes in MIPS (left three bars) or complexes identified in this study (right three bars). In MIPS, approximately 80% of “aggravating” complexes (see text) contain an essential gene, versus 20% for “alleviating” complexes. The trend is similar for the complexes reported in this study, with 55% versus 22% of aggravating versus alleviating complexes containing an essential gene. The list of all essential genes was taken from (http://www-sequence.stanford.edu/group/yeast_deletion_project/deletions3.html).
Figure 5
Figure 5. Pathway models identify novel functional associations among cellular machinery.
Each panel represents complexes and between-complex links taken from Figure 2. Physical interactions with PE>1 are shown and strong genetic interactions (|S|>2.5) are shown with increased thicknesses corresponding to stronger genetic interactions. (A) Histone acetyltransferase complex RTT109 – VPS75 showing strong alleviating interactions with the Elongator transcription elongation factor complex. (B) Between-complex model highlighting alleviating interactions between the LRP1 – RRP6 nuclear exosome complex and an mRNA degradation complex. (C) Complexes associated with the RAD6-C histone ubiquitination complex (BRE1/LGE1).

References

    1. Avery L, Wasserman S. Ordering gene function: the interpretation of epistasis in regulatory hierarchies. Trends Genet. 1992;8:312–316. - PMC - PubMed
    1. Carter GW, Prinz S, Neou C, Shelby JP, Marzolf B, et al. Prediction of phenotype and gene expression for combinations of mutations. Mol Syst Biol. 2007;3:96. - PMC - PubMed
    1. Hereford LM, Hartwell LH. Sequential gene function in the initiation of Saccharomyces cerevisiae DNA synthesis. J Mol Biol. 1974;84:445–461. - PubMed
    1. Ooi SL, Shoemaker DD, Boeke JD. DNA helicase gene interaction network defined using synthetic lethality analyzed by microarray. Nat Genet. 2003;35:277–286. - PubMed
    1. Tong AH, Evangelista M, Parsons AB, Xu H, Bader GD, et al. Systematic genetic analysis with ordered arrays of yeast deletion mutants. Science. 2001;294:2364–2368. - PubMed

Publication types