. 2008 Apr 18;4(4):e1000042.
doi: 10.1371/journal.ppat.1000042.

An unbiased systems genetics approach to mapping genetic loci modulating susceptibility to severe streptococcal sepsis

Affiliations

An unbiased systems genetics approach to mapping genetic loci modulating susceptibility to severe streptococcal sepsis

Nourtan F Abdeltawab et al. PLoS Pathog. .

Abstract

Striking individual differences in severity of group A streptococcal (GAS) sepsis have been noted, even among patients infected with the same bacterial strain. We had provided evidence that HLA class II allelic variation contributes significantly to differences in systemic disease severity by modulating host responses to streptococcal superantigens. Inasmuch as the bacteria produce additional virulence factors that participate in the pathogenesis of this complex disease, we sought to identify additional gene networks modulating GAS sepsis. Accordingly, we applied a systems genetics approach using a panel of advanced recombinant inbred mice. By analyzing disease phenotypes in the context of mice genotypes we identified a highly significant quantitative trait locus (QTL) on Chromosome 2 between 22 and 34 Mb that strongly predicts disease severity, accounting for 25%-30% of variance. This QTL harbors several polymorphic genes known to regulate immune responses to bacterial infections. We evaluated candidate genes within this QTL using multiple parameters that included linkage, gene ontology, variation in gene expression, cocitation networks, and biological relevance, and identified interleukin1 alpha and prostaglandin E synthases pathways as key networks involved in modulating GAS sepsis severity. The association of GAS sepsis with multiple pathways underscores the complexity of traits modulating GAS sepsis and provides a powerful approach for analyzing interactive traits affecting outcomes of other infectious diseases.


Conflict of interest statement

The authors have declared that no competing interests exist.

Figures
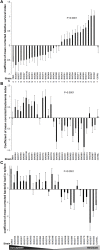
Figure 1
Figure 1. Differential susceptibility to GAS sepsis among different BXD strains and their parental strains.
(A) Rank-ordered bar chart of survival expressed as mean values of coefficient of mean corrected relative survival indices (cRSI) across 30 different BXD strains and their parental strains (DBA/2J and C57Bl/6J) at the two extremes of the X-axis. Error bars represent the standard errors of the means. Statistical test is two-way ANOVA (with correction to covariates) P≤0.0001. Total number of mice is 489 belonging to 32 strains; number of mice used per strain is indicated. (B) Bar chart of GAS bacteremia expressed as coefficient of mean values of corrected log blood CFUs 24 h post injection (corrected log CFU/ml blood). Strains are ordered by their corrected relative survival indices with the parental strains at the two extremes of the X-axis. Error bars represent the standard errors of the means. Statistical test is two-way ANOVA (with correction to covariates) P≤0.0001. (C) Bar chart of GAS dissemination to spleen expressed as coefficient of corrected bacterial load in spleen (log CFU/spleen). Strains are ordered by their corrected relative survival indices with the parental strains at the two extremes of the X-axis. Error bars represent the standard errors of the means. Statistical test is two-way ANOVA (with correction to covariates) P≤0.0001.
Figure 2
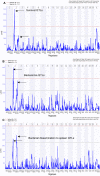
Figure 2. Genome-wide scan for mice susceptibility to GAS sepsis showing mapped QTL on Chr 2.
(A) Interval mapping of survival (expressed as corrected relative survival index, cRSI), showing a significant QTL (based on 1000 permutation tests) on Chr 2 between 22–34 Mb with LRS of 34.2 (P≤0.0000001), and a suggestive QTL between 125–150 Mb with LRS of 12 (P≤0.001). (B) Whole genome interval mapping of GAS bacteremia using bacterial load 24 h post injection expressed as corrected log CFU/ml blood, showing two QTLs on Chr 2: first QTL between 22–34 Mb with LRS of 24.5 (P≤0.00001) and a second with LRS of 17 (P≤0.0001) between 125–150 Mb. (C) Whole genome mapping of GAS sepsis using tissue dissemination of GAS expressed as corrected log CFU/spleen with QTL between 125–150 Mb with LRS of 15 (P≤0.0001). Red line indicates significant LRS, while grey line indicates suggestive LRS. Upper x-axis shows mouse chromosomes, and lower x-axis shows physical map in mega bases, y-axis represents linkage in LRS score.
Figure 3
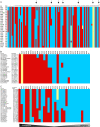
Figure 3. Recombinant inbred BXD strain distribution patterns at region of interest on Chr 2.
(A) Haplotype maps of the first QTL on Chr 2 between 20–34 Mb showing available BXD strains. Haplotype maps were used for in silico selection of strains for survival studies based on the strain distribution patterns, where B allele (blue bars) inherited from the resistant parent C57Bl/6J and D alleles form the susceptible parent DBA/2J, beige bars indicate strains that are heterozygous at this region, resembling an F1. Arrows indicate BXD strains 34, 51, 60, 64, 79, 94, and 100. (B) Haplotype maps of the first QTL region on Chr 2 between 20—34 Mb across BXD strains used in the population-based survival experiments showing the pattern of alleles inherited from each parent at region of interest on Chr 2. The different BXD strains are rank-ordered according to their susceptibility to GAS sepsis form susceptible to more resistant. Resistant strains show a pattern of accumulation of alleles inherited from resistant parent (B) C57Bl/6J (blue bars) while the susceptible strains show a pattern of alleles from susceptible parent (D) DBA/2J (red bars), with the exception of BXD94 strain, heterozygous (beige bars) at the QTL region. (C) Haplotype maps of the second QTL region on Chr 2 between 125—150 Mb across BXD strains used in the population-based survival experiments showing the pattern of alleles inherited from each parent at region of interest on Chr 2. The different BXD strains are rank-ordered according to their susceptibility to GAS sepsis form susceptible to more resistant. BXD genotype data set can be downloaded from www.genenetwork.org/genotypes/BXD.geno.
Figure 4
Figure 4. Patterns of differential gene expression levels of candidate genes post infection in susceptible and resistant strains.
Quantitative PCR results showing levels of gene expression of 14 genes with significant (P = 0.05–0.08) change post-infection in susceptible and resistant strains, expressed as Log fold differences in gene expression level post-infection. Genes are grouped to three groups, a) genes up regulated in susceptible strains post-infection and decreased in resistant strains post-infection, b) genes down regulated in both susceptible and resistant strains post-infection, and c) genes up regulated in both susceptible and resistant strains post-infection. Susceptible strains are represented as solid black bars, and resistant strains as dashed bars. The bars represent 2–4 biological replicates run in three technical replicates each and significance is based on t-test. Anapc2, anaphase promoting complex subunit 2; Entpd2, ectonucleoside triphosphate diphosphohydrolase 2; Edf1, endothelial differentiation-related factor 1; Garnl3, GTPase activating RANGAP domain-like 3; Il1a, interleukin 1 alpha; Il1rn, interleukin 1receptor antagonist; Nfatc2, nuclear factor of activated t-cells, cytoplasmic, calcineurin-dependent 2; Phpt1, phosphohistidine phosphatase 1; Ptges, prostaglandin E synthase; Ptges2, prostaglandin E synthase 2; Psmd5, proteasome (prosome, macropain) 26S subunit, non-ATPase 5; Ppp2r4, Protein phosphatase 2A regulatory subunit B; Sh2d3c, SH2 domain containing 3C; Traf1, TNF a receptor associated factor 1.
Figure 5
Figure 5. Functional network of genes modulating GAS QTL.
Graphical representation of the molecular relationships between differentially expressed genes, showing the central role of IL-1, IL-1rn, PTGES, and PTGES2 in modulating response to GAS sepsis and their indirect interactions with IFN-γ and IL-2 networks in modulating bacterial sepsis. Genes are represented as nodes, and the biological relationship between two nodes is represented as line, solid lines represent direct interactions, dashed lines represent indirect interactions. Oval shapes represent chemical or drug, squares represent cytokines, diamond shapes represent enzymes, concentric circles represent group of family, and triangles represent phosphates. Blue lines and arrows represent expression levels of resistant strains, while red lines and arrows represent susceptible strains expression levels. Apyrase, ATP diphosphohydorlase; ANAPC2, anaphase promoting complex subunit 2; CDC20 cell division cycle homolog 20; CXCL14, chemokine (c-x-c motif) ligand 14; ENTPD2, ectonucleoside triphosphate diphosphohydrolase 2; EDF1, endothelial differentiation-related factor 1; JUN jun oncogene; IL1A, interleukin 1 alpha; IL1RN, interleukin 1receptor antagonist; IFNG interferon gamma; IL2 interleukin2; PDCD1LG2, programmed cell death ligand 2; PTGES, prostaglandin E synthase; PTGES2, prostaglandin E synthase 2; PSMC3 proteasome (prosome, macropain) 26S subunit ATPase 3; PSMD5, proteasome (prosome, macropain) 26S subunit, non-ATPase 5; PPP2R4, protein phosphatase 2A regulatory subunit B; RBM39, RNA binding protein 39; SH2D3C, SH2 domain containing 3C; SLC6A6, solute carrier family 6; TP53 tumor protein p53; TP53RK, TP53 regulating kinase; VTCN1, V-set domain containing T cell activation inhibitor 1.

References

    1. Aziz RK, Edwards RA, Taylor WW, Low DE, McGeer A, et al. Mosaic prophages with horizontally acquired genes account for the emergence and diversification of the globally disseminated M1T1 clone of Streptococcus pyogenes. J Bacteriol. 2005;187:3311–3318. - PMC - PubMed
    1. Sumby P, Porcella SF, Madrigal AG, Barbian KD, Virtaneva K, et al. Evolutionary origin and emergence of a highly successful clone of serotype M1 group a Streptococcus involved multiple horizontal gene transfer events. J Infect Dis. 2005;192:771–782. - PubMed
    1. Walker MJ, Hollands A, Sanderson-Smith ML, Cole JN, Kirk JK, et al. DNase Sda1 provides selection pressure for a switch to invasive group A streptococcal infection. Nat Med. 2007;13:981–985. - PubMed
    1. Low DE, Schwartz B, McGeer A. Washington, D.C: American Society for Microbiology Press; 1997. The reemergence of severe group A streptococcal disease: an evolutionary perspetive. pp. 93–123.
    1. Chatellier S, Ihendyane N, Kansal RG, Khambaty F, Basma H, et al. Genetic relatedness and superantigen expression in group A streptococcus serotype M1 isolates from patients with severe and nonsevere invasive diseases. Infect Immun. 2000;68:3523–3534. - PMC - PubMed

Publication types

MeSH terms