. 2008;12(2):R53.
doi: 10.1186/cc6872. Epub 2008 Apr 18.

The influence of venous admixture on alveolar dead space and carbon dioxide exchange in acute respiratory distress syndrome: computer modelling

Affiliations

The influence of venous admixture on alveolar dead space and carbon dioxide exchange in acute respiratory distress syndrome: computer modelling

Lisbet Niklason et al. Crit Care. 2008.

Abstract

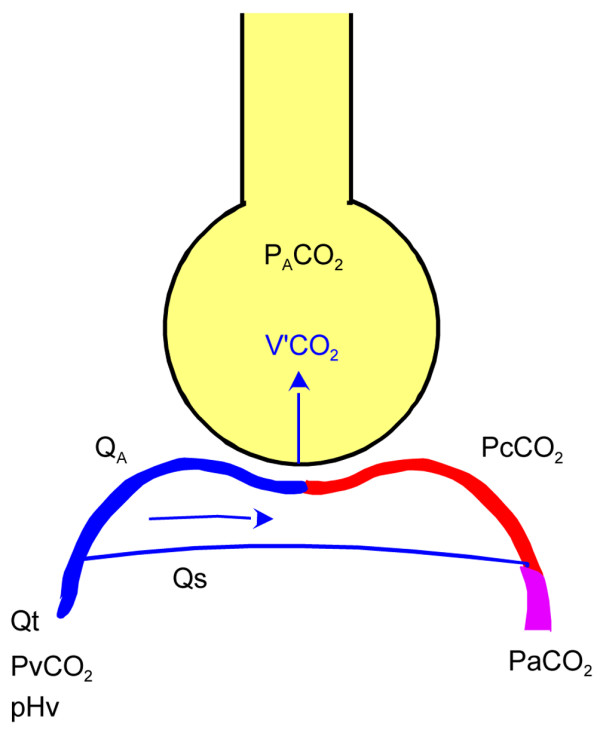
Introduction: Alveolar dead space reflects phenomena that render arterial partial pressure of carbon dioxide higher than that of mixed alveolar gas, disturbing carbon dioxide exchange. Right-to-left shunt fraction (Qs/Qt) leads to an alveolar dead space fraction (VdAS/VtA; where VtA is alveolar tidal volume). In acute respiratory distress syndrome, ancillary physiological disturbances may include low cardiac output, high metabolic rate, anaemia and acid-base instability. The purpose of the present study was to analyze the extent to which shunt contributes to alveolar dead space and perturbs carbon dioxide exchange in ancillary physiological disturbances.

Methods: A comprehensive model of pulmonary gas exchange was based upon known equations and iterative mathematics.

Results: The alveolar dead space fraction caused by shunt increased nonlinearly with Qs/Qt and, under 'basal conditions', reached 0.21 at a Qs/Qt of 0.6. At a Qs/Qt of 0.4, reduction in cardiac output from 5 l/minute to 3 l/minute increased VdAS/VtA from 0.11 to 0.16. Metabolic acidosis further augmented the effects of shunt on VdAS/VtA, particularly with hyperventilation. A Qs/Qt of 0.5 may increase arterial carbon dioxide tension by about 15% to 30% if ventilation is not increased.

Conclusion: In acute respiratory distress syndrome, perturbation of carbon dioxide exchange caused by shunt is enhanced by ancillary disturbances such as low cardiac output, anaemia, metabolic acidosis and hyperventilation. Maintained homeostasis mitigates the effects of shunt.


Figures

Figure 1
Figure 1
Simplified lung model. Total cardiac output (Qt) was distributed to ventilated capillaries (QA) and to a right-to-left shunt (Qs). At steady state the alveolar carbon dioxide tension (PaCO2) is the same as in the end-capillary blood (PcCO2). V'CO2, eliminated carbon dioxide (ml/minute); pHv, venous pH; PvCO2, venous carbon dioxide tension; PaCO2, arterial carbon dioxide tension.
Figure 2
Figure 2
Outline of calculations further detailed in Additional file 1. (a) Starting out from input parameters, analytical calculations of intermediate parameters were performed using standard equations. (b) Input parameters, together with venous oxygen content (CvO2) and arterial oxygen content (CaO2), define unique values of venous oxygen saturation (SvO2) and arterial oxygen saturation (SaO2), which were iteratively determined. Venous carbon dioxide content (CvCO2) was calculated in accordance with the method reported by Giovannini and coworkers [10]. (c) In an extensive system of iterations, arterial carbon dioxide tension (PaCO2) was iteratively adjusted until veno-arterial difference in carbon dioxide content (ΔC [v-a]CO2) multiplied by total cardiac output (Qt) became equal to carbon dioxide elimination (V'CO2). In a step parallel to that shown in panel c, end-capillary carbon dioxide tension (PcCO2) was iteratively determined employing the value of QA (blood flow to ventilated alveoli) instead of Qt.
Figure 3
Figure 3
Alveolar dead space fraction versus shunt fraction at varying cardiac output. Shown is the alveolar dead space fraction (VdAS/VtA) versus shunt fraction (Qs/Qt) at varying cardiac output (Qt).
Figure 4
Figure 4
Alveolar dead space fraction versus shunt fraction at varying acid base status. Alveolar dead space fraction (VdAS/VtA) versus shunt fraction (Qs/Qt) at varying acid-base status. Respiratory acidosis I and II refer to arterial carbon dioxide tension (PaCO2) values of 9.1 kPa and 15.8 kPa, respectively, yielding arterial pH (pHa) values of 7.25 and 7.09, respectively. Metabolic acidosis I and II refer to base excess (BE) values of -9.0 mmol/l and -17 mmol/l, yielding pHa values of 7.25 and 7.10, respectively.
Figure 5
Figure 5
Alveolar dead space fraction versus shunt fraction at additive ancillary pathology. Alveolar dead space fraction (VdAS/VtA) versus shunt fraction (Qs/Qt) at additive ancillary pathology. Step-wise analyses of effects of a low haemoglobin (Hb; 97 g/l), low Hb and Qt (3.5 l/minute), low Hb and Qt and metabolic acidosis (base excess [BE] -13 mmol/l), and the latter case after respiratory compensation for acidosis by hyperventilation (arterial carbon dioxide tension [PaCO2] 2.1 kPa).
Figure 6
Figure 6
Increase in PaCO2 or alveolar ventilation versus shunt fraction. Increase in arterial carbon dioxide tension (PaCO2; %) at constant alveolar ventilation versus shunt fraction. This is equivalent to required increase in alveolar ventilation to maintain PaCO2. Examples are as follows: 'Basal': Qt = 5 l/minute, haemoglobin (Hb) = 145 g/l and base excess (BE) = 0; 'Qt = 3': Qt = 3 l/minute, Hb = 145 g/l and BE = 0; and 'Metab. acidosis': Qt = 3.5 l/minute, Hb = 97 g/l and BE = -13.
Figure 7
Figure 7
Increase in total ventilation versus shunt fraction at constant PaCO2. Required increase in total ventilation (%) at different shunt fractions (Qs/Qt) to maintain arterial carbon dioxide tension (PaCO2) constant. Examples are as follows: 'Basal': Qt = 5 l/minute, haemoglobin (Hb) = 145 g/l and base excess (BE) = 0; 'Qt = 3': Qt = 3 l/minute, Hb = 145 g/l and BE = 0; and 'Metab. acidosis': Qt = 3.5 l/minute, Hb = 97 g/l and BE = -13. Airway dead space (Vdaw) and the alveolar dead space caused by uneven ventilation/perfusion (VdAVQ) were assumed to be 0.2 l and 0.06 l, respectively.

Comment in

References

    1. Beydon L, Uttman L, Rawal R, Jonson B. Effects of positive end-expiratory pressure on dead space and its partitions in acute lung injury. Intensive Care Med. 2002;28:1239–1245. doi: 10.1007/s00134-002-1419-y. - DOI - PubMed
    1. Nuckton TJ, Alonso JA, Kallet RH, Daniel BM, Pittet JF, Eisner MD, Matthay MA. Pulmonary dead-space fraction as a risk factor for death in the acute respiratory distress syndrome. N Engl J Med. 2002;346:1281–1286. doi: 10.1056/NEJMoa012835. - DOI - PubMed
    1. Åström E, Uttman L, Niklason L, Aboab J, Brochard L, Jonson B. Pattern of inspiratory gas delivery affects CO2 elimination in health and after acute lung injury. Intensive Care Med. 2008;34:377–384. doi: 10.1007/s00134-007-0840-7. - DOI - PubMed
    1. West JB. Ventilation-perfusion inequality and overall gas exchange in computer models of the lung. Respir Physiol. 1969;7:88–110. doi: 10.1016/0034-5687(69)90071-1. - DOI - PubMed
    1. Fletcher R, Jonson B, Cumming G, Brew J. The concept of deadspace with special reference to the single breath test for carbon dioxide. Br J Anaesth. 1981;53:77–88. doi: 10.1093/bja/53.1.77. - DOI - PubMed

Publication types

MeSH terms

LinkOut - more resources