

doi: 10.1016/j.jmr.2008.03.012.
Epub 2008 Mar 23.
Pulse sequence for dynamic volumetric imaging of hyperpolarized metabolic products
Affiliations
- PMID: 18424203
- PMCID: PMC3051833
- DOI: 10.1016/j.jmr.2008.03.012
Item in Clipboard
Pulse sequence for dynamic volumetric imaging of hyperpolarized metabolic products
J Magn Reson.
2008 Jul.
Abstract
Dynamic nuclear polarization and dissolution of a (13)C-labeled substrate enables the dynamic imaging of cellular metabolism. Spectroscopic information is typically acquired, making the acquisition of dynamic volumetric data a challenge. To enable rapid volumetric imaging, a spectral-spatial excitation pulse was designed to excite a single line of the carbon spectrum. With only a single resonance present in the signal, an echo-planar readout trajectory could be used to resolve spatial information, giving full volume coverage of 32 x 32 x 16 voxels every 3.5s. This high frame rate was used to measure the different lactate dynamics in different tissues in a normal rat model and a mouse model of prostate cancer.
Figures
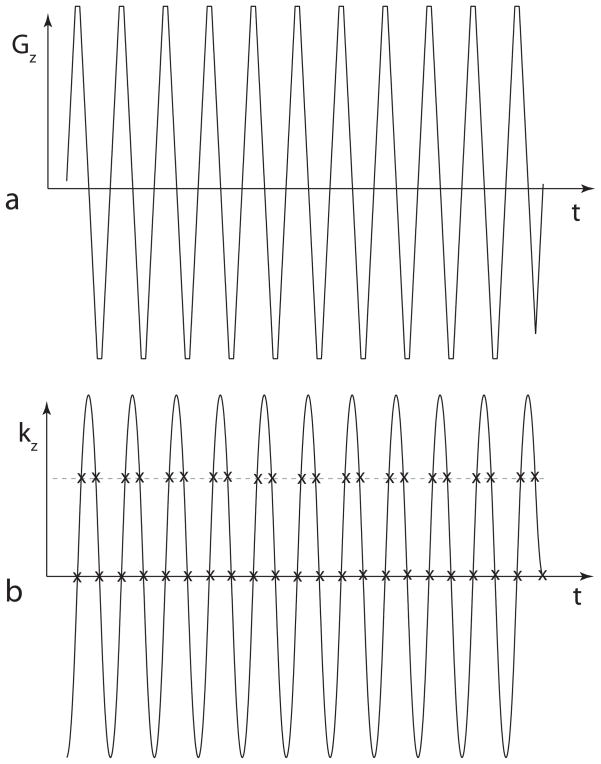
The zig-zag trajectory through excitation k-space. (a) A gradient waveform used with a typical spectral-spatial RF pulse. (b) The integral of the gradient shape gives the trajectory through excitation k-space. The “x” marks show that the sample spacing across the central region is uniform, but is staggered away from the center. Compensating for this staggered sampling is the key to the design technique used in this paper.
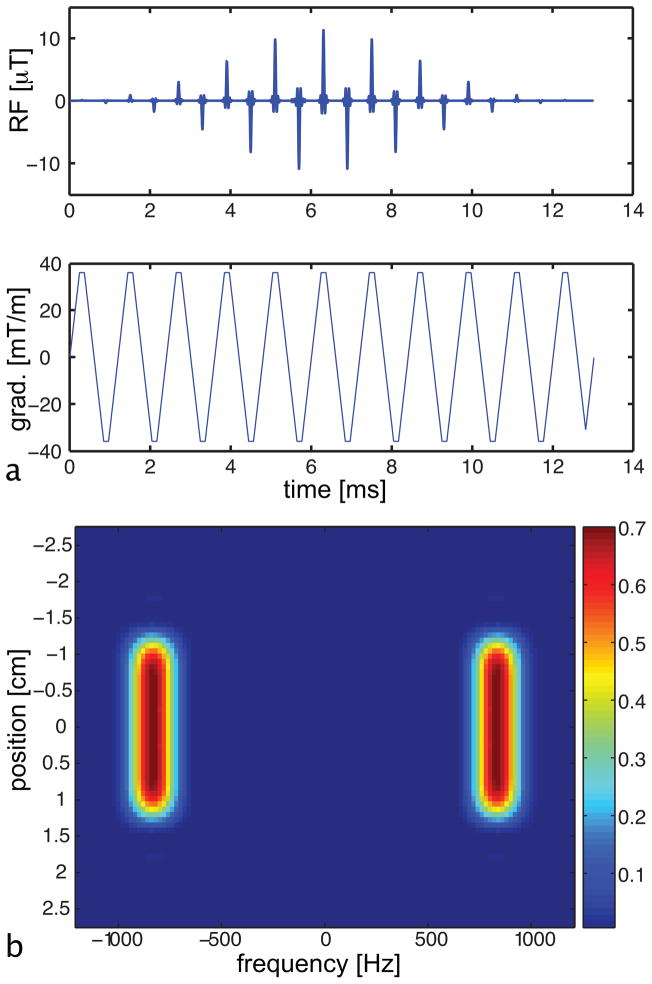
Spectral-spatial RF pulse designed for imaging single components of the 13C spectrum. (a) The RF pulse and gradient waveform. (b) The excitation profile of the spectral-spatial pulse as a function of frequency and position, with the color corresponding to the magnitude of the resulting transverse magnetization normalized by M0. Note the large spectral stopband and the sharp spatial selectivity of the pulse.
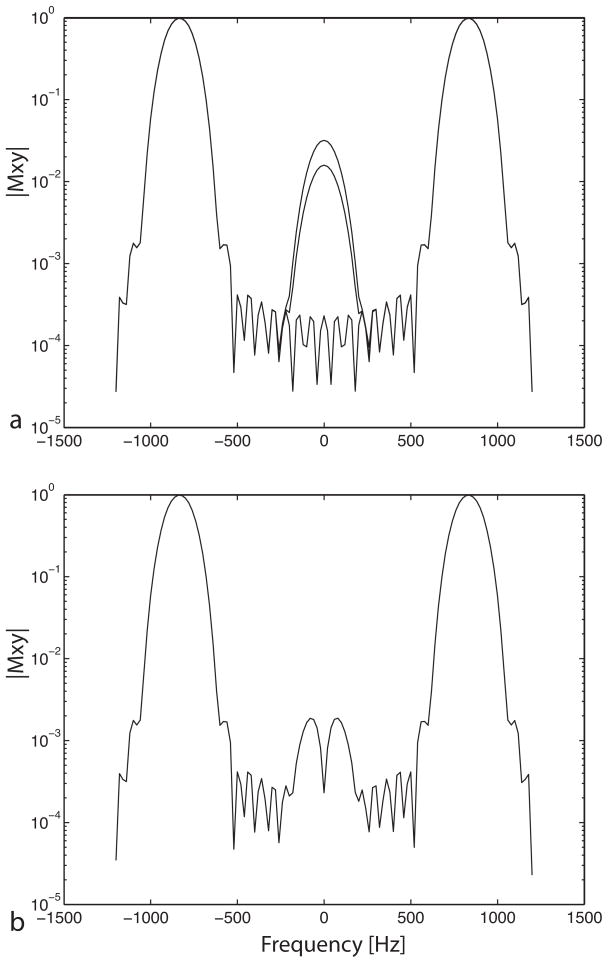
Suppression in the spectral stopband of the spectral-spatial pulse. Plots of the spectral profile at the center of the slice as well as two intermediate positions within the slice are shown overlapping. (a) The spectral profile of the pulse shows inadequate suppression in the stopband, seen as the lobes at 0 Hz. (b) With the new design that compensates for the zig-zag trajectory through excitation k-space, this lobe is suppressed giving 60 dB attenuation. This level of attenuation is achieved at all locations within the slice, as seen by the identical overlapping plots.
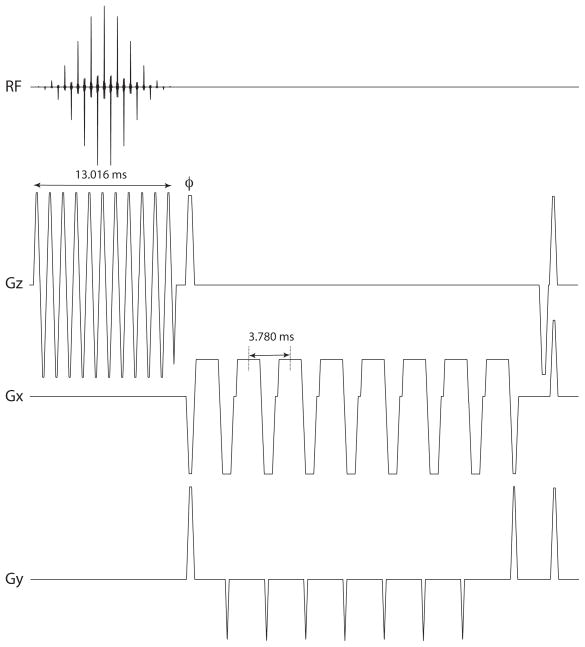
Echo-planar pulse sequence used in experiments. The sequence consists of a 13.016 ms spectral-spatial RF excitation pulse followed by a gradient lobe to phase-encode the through-slice direction (labeled φ). The four lobes of the echo-planar readout gradient on Gx are separated by 3.780 ms, with blips on Gy in between.
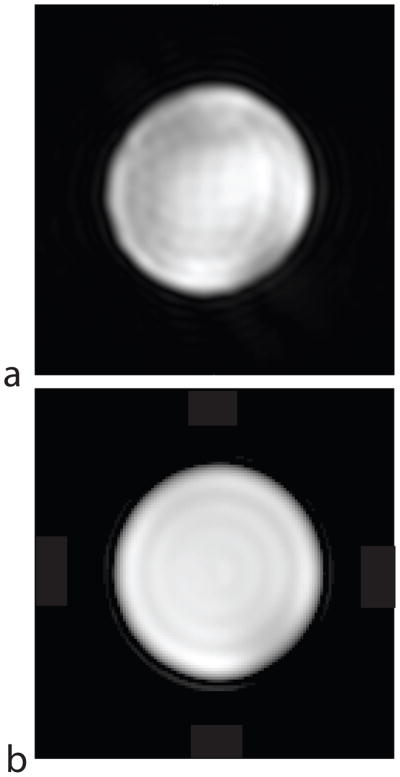
Phantom experiment showing spatial resolution of the new pulse sequence. (a) New pulse sequence, TR = 55 ms, TE = 22.5 ms, scan time = 3.5 s, 32×32×16 voxels. (b) Conventional chemical shift imaging (CSI) sequence with phase encoding in both in-plane directions, TR = 600 ms, TE = 1 ms, scan time = 614 s, 3202×32×1 voxels. For both scans, the FOV was 8 cm and the slice thickness was 5 mm.
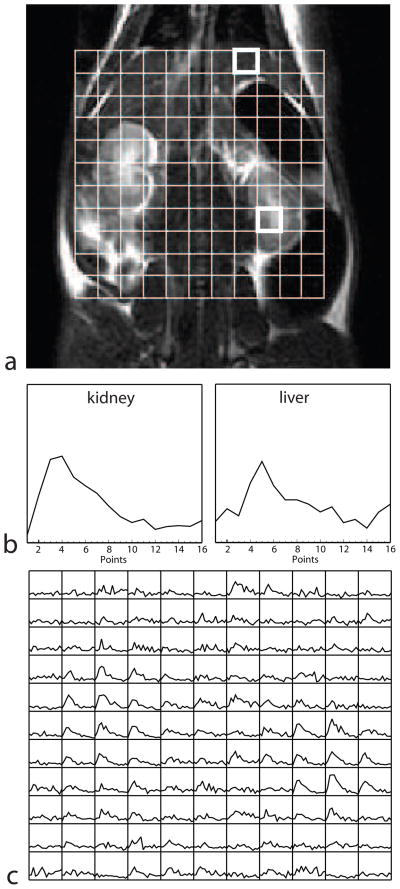
Data showing lactate dynamics in different tissues of the rat model. (a) A grid showing the arrangement of the 5 × 5 × 5 mm voxels is overlaid on the anatomical (proton) image. (b) Lactate signal at each 5 s time-point is shown for kidney and liver tissue. The time courses are from the upper and lower voxels highlighted in (a), respectively. (c) The lactate time-courses from all the voxels in the grid show different lactate metabolism in different tissues (each grid element shows the lactate signal as a function of time).
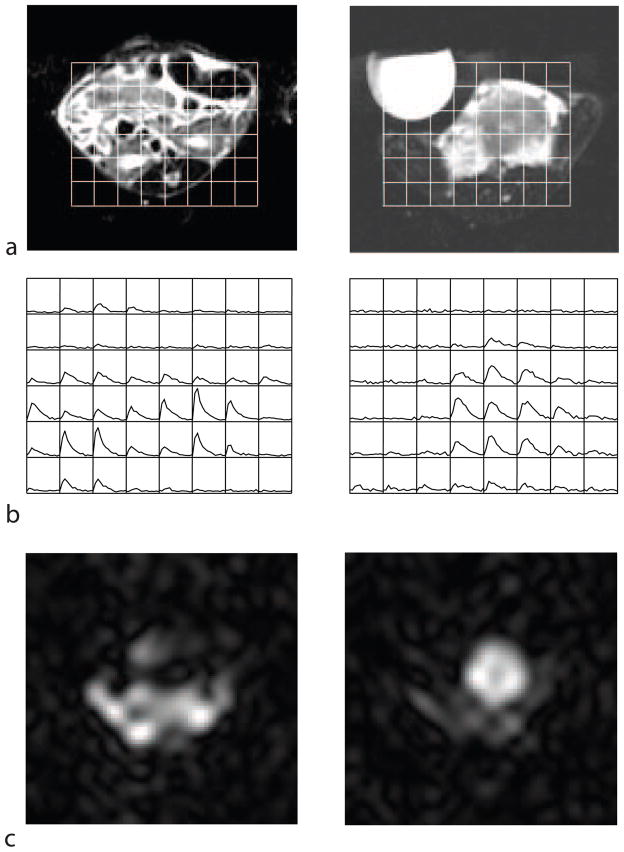
Measurements of lactate dynamics in the TRAMP mouse model. (a) The voxel (3 × 3 × 4 mm) locations for the 13C data are shown overlaid on an axial proton image through two slices, through the abdomen of the mouse (left) and through the tumour (right). (b) The time-course of the 13C lactate produced in each voxel (each grid element shows the lactate signal as a function of time). (c) The lactate image taken at the 5th timepoint. The syringe seen to the left of the tumour in (a) contained a 13C-lactate reference, but this signal was below the noise floor of this rapid scan. The signal seen outside the abdomen is likely a combination of noise, Gibbs ringing, and artifact due to the lactate signal changing during the volume acquisition.
References
-
- Wolber J, Ellner F, Fridlund B, Gram A, Johannesson H, Hansson G, Hansson L, Lerche MH, Mansson S, Servin R, Thaning M, Golman K, Ardenkjaer-Larson JH. Generating highly polarized nuclear spins in solution using dynamic nuclear polarization. Nucl Instr Meth Phys Res A. 2004;526:173–181.
-
- Golman K, Zandt RI, Lerche M, Pehrson R, Ardenkjaer-Larson JH. Metabolic imaging by hyperpolarized 13C magnetic resonance imaging for in vivo tumour diagnosis. Cancer Res. 2006;66:10855–10860. - PubMed
Publication types
MeSH terms
Substances
Grants and funding
LinkOut - more resources
Full Text Sources
Other Literature Sources
Medical
