

Identification of the first steps in charge separation in bacterial photosynthetic reaction centers of Rhodobacter sphaeroides by ultrafast mid-infrared spectroscopy: electron transfer and protein dynamics
- PMID: 18424493
- PMCID: PMC2479572
- DOI: 10.1529/biophysj.108.130880
Identification of the first steps in charge separation in bacterial photosynthetic reaction centers of Rhodobacter sphaeroides by ultrafast mid-infrared spectroscopy: electron transfer and protein dynamics
Erratum in
- Biophys J. 2008 Oct;95(8):4089
Abstract
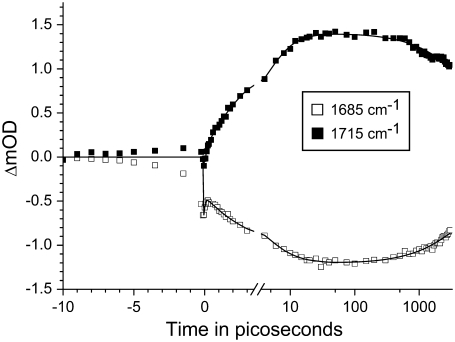
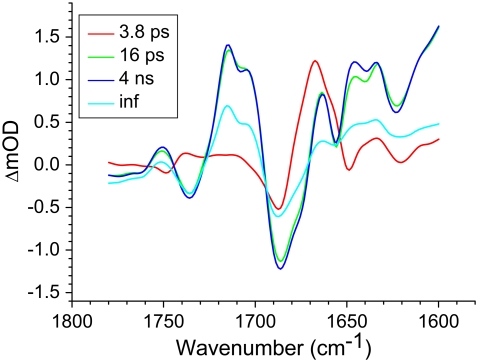
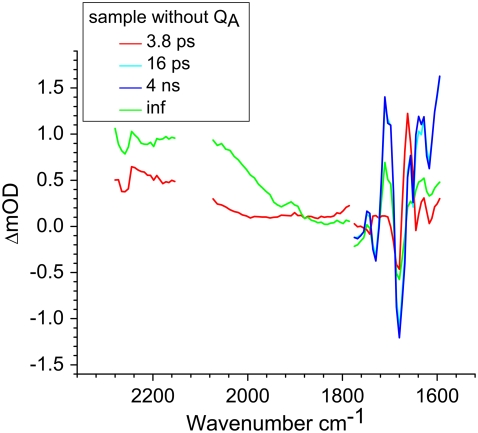
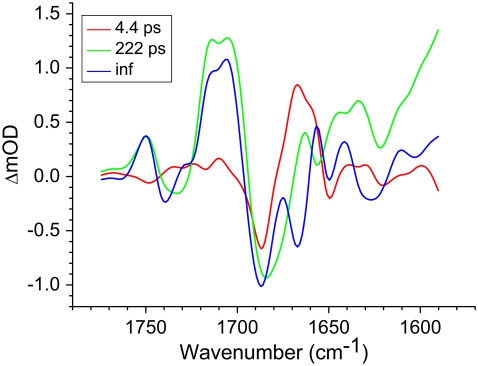
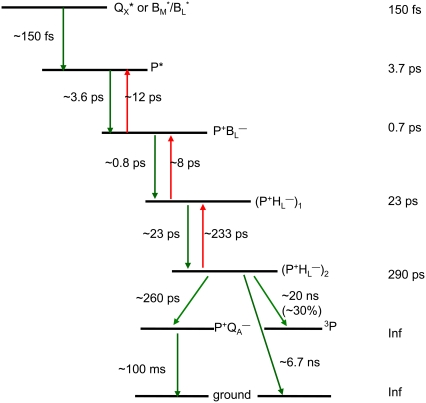
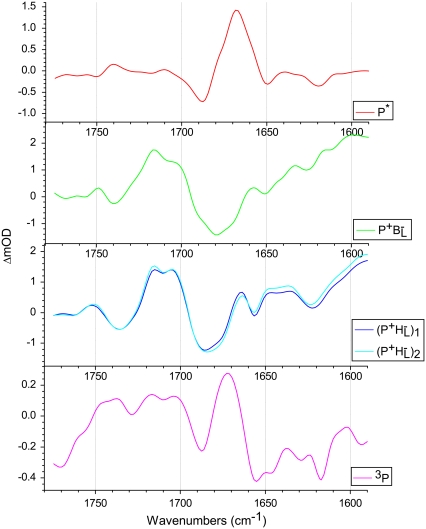
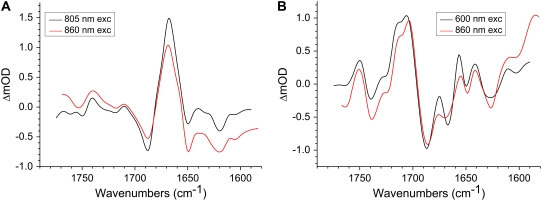
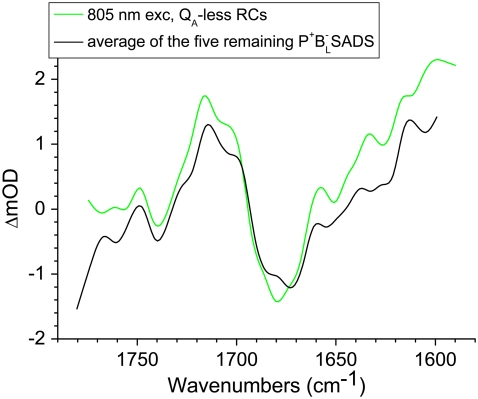
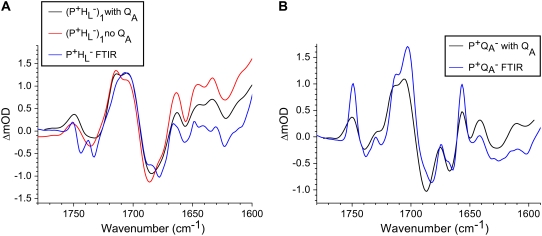
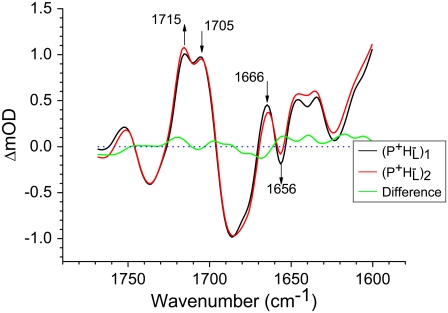
Time-resolved visible pump/mid-infrared (mid-IR) probe spectroscopy in the region between 1600 and 1800 cm(-1) was used to investigate electron transfer, radical pair relaxation, and protein relaxation at room temperature in the Rhodobacter sphaeroides reaction center (RC). Wild-type RCs both with and without the quinone electron acceptor Q(A), were excited at 600 nm (nonselective excitation), 800 nm (direct excitation of the monomeric bacteriochlorophyll (BChl) cofactors), and 860 nm (direct excitation of the dimer of primary donor (P) BChls (P(L)/P(M))). The region between 1600 and 1800 cm(-1) encompasses absorption changes associated with carbonyl (C=O) stretch vibrational modes of the cofactors and protein. After photoexcitation of the RC the primary electron donor P excited singlet state (P*) decayed on a timescale of 3.7 ps to the state P(+)B(L)(-) (where B(L) is the accessory BChl electron acceptor). This is the first report of the mid-IR absorption spectrum of P(+)B(L)(-); the difference spectrum indicates that the 9-keto C=O stretch of B(L) is located around 1670-1680 cm(-1). After subsequent electron transfer to the bacteriopheophytin H(L) in approximately 1 ps, the state P(+)H(L)(-) was formed. A sequential analysis and simultaneous target analysis of the data showed a relaxation of the P(+)H(L)(-) radical pair on the approximately 20 ps timescale, accompanied by a change in the relative ratio of the P(L)(+) and P(M)(+) bands and by a minor change in the band amplitude at 1640 cm(-1) that may be tentatively ascribed to the response of an amide C=O to the radical pair formation. We conclude that the drop in free energy associated with the relaxation of P(+)H(L)(-) is due to an increased localization of the electron hole on the P(L) half of the dimer and a further consequence is a reduction in the electrical field causing the Stark shift of one or more amide C=O oscillators.
Figures

References
-
- Deisenhofer, J., O. Epp, I. Sinning, and H. Michel. 1995. Crystallographic refinement at 2.3-angstrom resolution and refined model of the photosynthetic reaction center from Rhodopseudomonas viridis. J. Mol. Biol. 246:429–457. - PubMed
-
- Chirino, A. J., E. J. Lous, M. Huber, J. P. Allen, C. C. Schenck, M. L. Paddock, G. Feher, and D. C. Rees. 1994. Crystallographic analyses of site-directed mutants of the photosynthetic reaction center from Rhodobacter sphaeroides. Biochemistry. 33:4584–4593. - PubMed
-
- Lancaster, C. R. D., U. Ermler, and H. Michel. 1995. Anoxygenic Photosynthetic Bacteria. Kluwer Academic, Dordrecht, The Netherlands. 503–526.
-
- Woodbury, N. W., and J. P. Allen. 1995. The pathway, kinetics and thermodynamics of electron transfer in wild type and mutant bacterial reaction centers of purple nonsulfur bacteria. In Anoxygenic Photosynthetic Bacteria. M. T. M. R. E. Blankenship, and C. E. Bauer, editors. Kluwer Academic, Dordrecht, The Netherlands. 527–557.
-
- van Brederode, M. E., and M. R. Jones. 2000. Reaction centres of purple bacteria. In Enzyme-Catalyzed Electron and Radical Transfer. N. S. S. A. Holzenburg, editor. Kluwer Academic/Plenum, New York. 621–676. - PubMed
Publication types
MeSH terms
Substances
Grants and funding
LinkOut - more resources
Full Text Sources
