

Development and experimental validation of a predictive threshold cycle equation for quantification of virulence and marker genes by high-throughput nanoliter-volume PCR on the OpenArray platform
- PMID: 18424532
- PMCID: PMC2446556
- DOI: 10.1128/AEM.02743-07
Development and experimental validation of a predictive threshold cycle equation for quantification of virulence and marker genes by high-throughput nanoliter-volume PCR on the OpenArray platform
Abstract
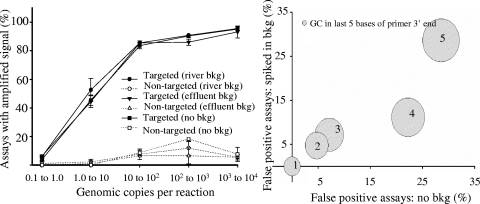
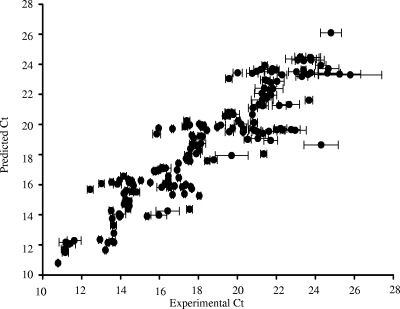
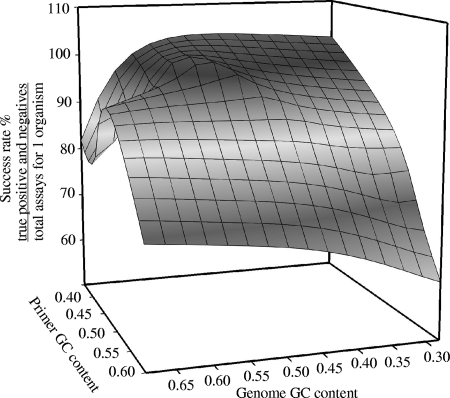
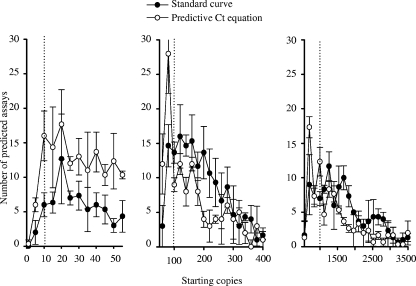
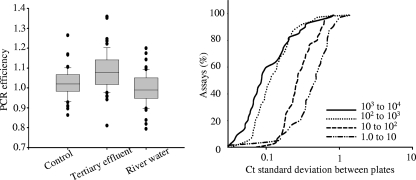
Development of quantitative PCR (QPCR) assays typically requires extensive screening within and across a given species to ensure specific detection and lucid identification among various pathogenic and nonpathogenic strains and to generate standard curves. To minimize screening requirements, multiple virulence and marker genes (VMGs) were targeted simultaneously to enhance reliability, and a predictive threshold cycle (C(T)) equation was developed to calculate the number of starting copies based on an experimental C(T). The empirical equation was developed with Sybr green detection in nanoliter-volume QPCR chambers (OpenArray) and tested with 220 previously unvalidated primer pairs targeting 200 VMGs from 30 pathogens. A high correlation (R(2) = 0.816) was observed between the predicted and experimental C(T)s based on the organism's genome size, guanine and cytosine (GC) content, amplicon length, and stability of the primer's 3' end. The performance of the predictive C(T) equation was tested using 36 validation samples consisting of pathogenic organisms spiked into genomic DNA extracted from three environmental waters. In addition, the primer success rate was dependent on the GC content of the target organisms and primer sequences. Targeting multiple assays per organism and using the predictive C(T) equation are expected to reduce the extent of the validation necessary when developing QPCR arrays for a large number of pathogens or other targets.
Figures
References
-
- Abdulmawjood, A., S. Roth, and M. Bulte. 2002. Two methods for construction of internal amplification controls for the detection of Escherichia coli O157 by polymerase chain reaction. Mol. Cell. Probes 16:335-339. - PubMed
-
- Becker, K., A. W. Friedrich, G. Peters, and C. von Eiff. 2004. Systematic survey on the prevalence of genes coding for staphylococcal enterotoxins SEIM, SEIO, and SEIN. Mol. Nutr. Food Res. 48:488-495. - PubMed
-
- Behets, J., P. Declerck, Y. Delaedt, L. Verelst, and F. Ollevier. 2007. A duplex real-time PCR assay for the quantitative detection of Naegleria fowleri in water samples. Water Res. 41:118-126. - PubMed
-
- Blanco, J., M. Blanco, J. E. Blanco, A. Mora, E. A. Gonzalez, M. I. Bernardez, M. P. Alonso, A. Coira, A. Rodriguez, J. Rey, J. A. Alonso, and M. A. Usera. 2003. Verotoxin-producing Escherichia coli in Spain: prevalence, serotypes, and virulence genes of O157:H7 and non-O157 VTEC in ruminants, raw beef products, and humans. Exp. Biol. Med. (Maywood) 228:345-351. - PubMed
Publication types
MeSH terms
Substances
Grants and funding
LinkOut - more resources
Full Text Sources
Other Literature Sources
Research Materials
Miscellaneous
