Influence of environmental stress on distributions of times to first division in Escherichia coli populations, as determined by digital-image analysis of individual cells
- PMID: 18424538
- PMCID: PMC2446540
- DOI: 10.1128/AEM.02551-07
Influence of environmental stress on distributions of times to first division in Escherichia coli populations, as determined by digital-image analysis of individual cells
Abstract
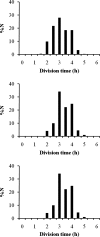
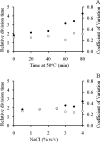
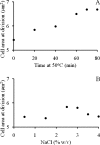
The distributions of times to first cell division were determined for populations of Escherichia coli stationary-phase cells inoculated onto agar media. This was accomplished by using automated analysis of digital images of individual cells growing on agar and calculation of the "box area ratio." Using approximately 300 cells per experiment, the mean time to first division and standard deviation for cells grown in liquid medium at 37 degrees C and inoculated on agar and incubated at 20 degrees C were determined as 3.0 h and 0.7 h, respectively. Distributions were observed to tail toward the higher values, but no definitive model distribution was identified. Both preinoculation stress by heating cultures at 50 degrees C and postinoculation stress by growth in the presence of higher concentrations of NaCl increased mean times to first division. Both stresses also resulted in an increase in the spread of the distributions that was proportional to the mean division time, the coefficient of variation being constant at approximately 0.2 in all cases. The "relative division time," which is the time to first division for individual cells expressed in terms of the cell size doubling time, was used as measure of the "work to be done" to prepare for cell division. Relative division times were greater for heat-stressed cells than for those growing under osmotic stress.
Figures


Similar articles
-
A novel method for measuring lag times in division of individual bacterial cells using image analysis.J Microbiol Methods. 2006 May;65(2):311-7. doi: 10.1016/j.mimet.2005.08.006. Epub 2005 Sep 19. J Microbiol Methods. 2006. PMID: 16169621
-
Cell division in Escherichia coli cultures monitored at single cell resolution.BMC Microbiol. 2008 Apr 23;8:68. doi: 10.1186/1471-2180-8-68. BMC Microbiol. 2008. PMID: 18430255 Free PMC article.
-
Effect of Hyperosmotic Salt Concentration and Temperature on Viability of Escherichia coli during Cold Storage.Biocontrol Sci. 2020;25(2):55-62. doi: 10.4265/bio.25.55. Biocontrol Sci. 2020. PMID: 32507791
-
Observing growth and division of large numbers of individual bacteria by image analysis.Appl Environ Microbiol. 2004 Feb;70(2):675-8. doi: 10.1128/AEM.70.2.675-678.2004. Appl Environ Microbiol. 2004. PMID: 14766541 Free PMC article.
-
Is Escherichia coli getting old?Bioessays. 2005 Aug;27(8):770-4. doi: 10.1002/bies.20271. Bioessays. 2005. PMID: 16015607 Review.
Cited by
-
Variability in Cell Response of Cronobacter sakazakii after Mild-Heat Treatments and Its Impact on Food Safety.Front Microbiol. 2016 Apr 19;7:535. doi: 10.3389/fmicb.2016.00535. eCollection 2016. Front Microbiol. 2016. PMID: 27148223 Free PMC article.
-
Modeling the Mechanics of Cell Division: Influence of Spontaneous Membrane Curvature, Surface Tension, and Osmotic Pressure.Front Physiol. 2017 May 19;8:312. doi: 10.3389/fphys.2017.00312. eCollection 2017. Front Physiol. 2017. PMID: 28579960 Free PMC article.
-
Supercharged MPNs? Automated Determination of High-Throughput Most Probable Number (htMPN) Using Chip-Based 3D Digital PCR.Appl Environ Microbiol. 2022 Aug 9;88(15):e0082222. doi: 10.1128/aem.00822-22. Epub 2022 Jul 20. Appl Environ Microbiol. 2022. PMID: 35856687 Free PMC article.
-
Mass and density measurements of live and dead Gram-negative and Gram-positive bacterial populations.Appl Environ Microbiol. 2014 Jun;80(12):3622-31. doi: 10.1128/AEM.00117-14. Appl Environ Microbiol. 2014. PMID: 24705320 Free PMC article.
-
A matter of life or death: modeling DNA damage and repair in bacteria.Biophys J. 2011 Feb 16;100(4):814-21. doi: 10.1016/j.bpj.2010.12.3713. Biophys J. 2011. PMID: 21320424 Free PMC article.
References
-
- Baranyi, J., and C. Pin. 2001. A parallel study on modelling bacterial growth and survival curves. J. Theor. Biol. 210:327-336. - PubMed
-
- Baranyi, J., and T. A. Roberts. 1994. A dynamic approach to predicting bacterial growth in food. Int. J. Food Microbiol. 23:277-294. - PubMed
-
- Booth, I. R. 2002. Stress and the single cell: intrapopulation diversity is a mechanism to ensure survival upon exposure to stress. Int. J. Food Microbiol. 78:19-30. - PubMed
-
- Brocklehurst, T. F., G. A. Mitchell, and A. C. Smith. 1997. A model experimental gel surface for the growth of bacteria on foods. Food Microbiol. 14:303-311.
Publication types
MeSH terms
Substances
LinkOut - more resources
Full Text Sources

