Minimal Escherichia coli cell for the most efficient production of ethanol from hexoses and pentoses
- PMID: 18424547
- PMCID: PMC2446564
- DOI: 10.1128/AEM.02708-07
Minimal Escherichia coli cell for the most efficient production of ethanol from hexoses and pentoses
Abstract
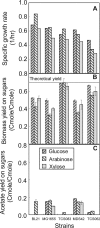
To obtain an efficient ethanologenic Escherichia coli strain, we reduced the functional space of the central metabolic network, with eight gene knockout mutations, from over 15,000 pathway possibilities to 6 pathway options that support cell function. The remaining pathways, identified by elementary mode analysis, consist of four pathways with non-growth-associated conversion of pentoses and hexoses into ethanol at theoretical yields and two pathways with tight coupling of anaerobic cell growth with ethanol formation at high yields. Elimination of three additional genes resulted in a strain that selectively grows only on pentoses, even in the presence of glucose, with a high ethanol yield. We showed that the ethanol yields of strains with minimized metabolic functionality closely matched the theoretical predictions. Remarkably, catabolite repression was completely absent during anaerobic growth, resulting in the simultaneous utilization of pentoses and hexoses for ethanol production.
Figures


Similar articles
-
Continuous production of ethanol from hexoses and pentoses using immobilized mixed cultures of Escherichia coli strains.J Biotechnol. 2010 Oct 15;150(2):215-23. doi: 10.1016/j.jbiotec.2010.08.002. Epub 2010 Aug 10. J Biotechnol. 2010. PMID: 20699108 Free PMC article.
-
Metabolic engineering of Escherichia coli for efficient conversion of glycerol to ethanol.Appl Environ Microbiol. 2009 Nov;75(21):6696-705. doi: 10.1128/AEM.00670-09. Epub 2009 Sep 4. Appl Environ Microbiol. 2009. PMID: 19734340 Free PMC article.
-
Ethanol production from hexoses, pentoses, and dilute-acid hydrolyzate by Mucor indicus.FEMS Yeast Res. 2005 Apr;5(6-7):669-76. doi: 10.1016/j.femsyr.2004.10.013. FEMS Yeast Res. 2005. PMID: 15780667
-
Anaerobic respiration in engineered Escherichia coli with an internal electron acceptor to produce fuel ethanol.Ann N Y Acad Sci. 2008 Mar;1125:363-72. doi: 10.1196/annals.1419.020. Ann N Y Acad Sci. 2008. PMID: 18378606 Review.
-
Ethanol production from renewable resources.Adv Biochem Eng Biotechnol. 1999;65:207-41. doi: 10.1007/3-540-49194-5_9. Adv Biochem Eng Biotechnol. 1999. PMID: 10533436 Review.
Cited by
-
Responses to light intensity in a genome-scale model of rice metabolism.Plant Physiol. 2013 Jun;162(2):1060-72. doi: 10.1104/pp.113.216762. Epub 2013 May 2. Plant Physiol. 2013. PMID: 23640755 Free PMC article.
-
Flux Design: In silico design of cell factories based on correlation of pathway fluxes to desired properties.BMC Syst Biol. 2009 Dec 25;3:120. doi: 10.1186/1752-0509-3-120. BMC Syst Biol. 2009. PMID: 20035624 Free PMC article.
-
Modeling of Zymomonas mobilis central metabolism for novel metabolic engineering strategies.Front Microbiol. 2014 Feb 5;5:42. doi: 10.3389/fmicb.2014.00042. eCollection 2014. Front Microbiol. 2014. PMID: 24550906 Free PMC article.
-
Design and characterization of synthetic fungal-bacterial consortia for direct production of isobutanol from cellulosic biomass.Proc Natl Acad Sci U S A. 2013 Sep 3;110(36):14592-7. doi: 10.1073/pnas.1218447110. Epub 2013 Aug 19. Proc Natl Acad Sci U S A. 2013. PMID: 23959872 Free PMC article.
-
Rational design and construction of an efficient E. coli for production of diapolycopendioic acid.Metab Eng. 2010 Mar;12(2):112-22. doi: 10.1016/j.ymben.2009.11.002. Epub 2009 Nov 26. Metab Eng. 2010. PMID: 19944775 Free PMC article.
References
-
- Alper, H., Y. Jin, J. F. Moxley, and G. Stephanopoulos. 2005. Identifying gene targets for the metabolic engineering of lycopene biosynthesis in Escherichia coli. Metab. Eng. 7:155-164. - PubMed
-
- Bachmann, B. J. 1996. Derivations and genotypes of some mutant derivatives of Escherichia coli K-12, p. 2460-2488. In F. C. Neidhardt, R. Curtiss III, J. L. Ingraham, E. C. C. Lin, K. B. Low, B. Magasanik, W. S. Reznikoff, M. Riley, M. Schaechter, and H. E. Umbarger (ed.), Escherichia coli and Salmonella: cellular and molecular biology, 2nd ed., vol. 2. ASM Press, Washington, DC.
Publication types
MeSH terms
Substances
Grants and funding
LinkOut - more resources
Full Text Sources
Other Literature Sources

