. 2008 Jun 15;111(12):5562-70.
doi: 10.1182/blood-2007-11-126219. Epub 2008 Apr 18.

Flk2+ common lymphoid progenitors possess equivalent differentiation potential for the B and T lineages

Affiliations

Flk2+ common lymphoid progenitors possess equivalent differentiation potential for the B and T lineages

Holger Karsunky et al. Blood. .

Abstract

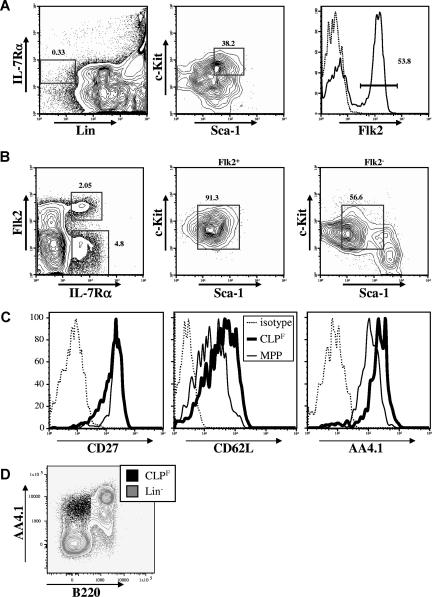
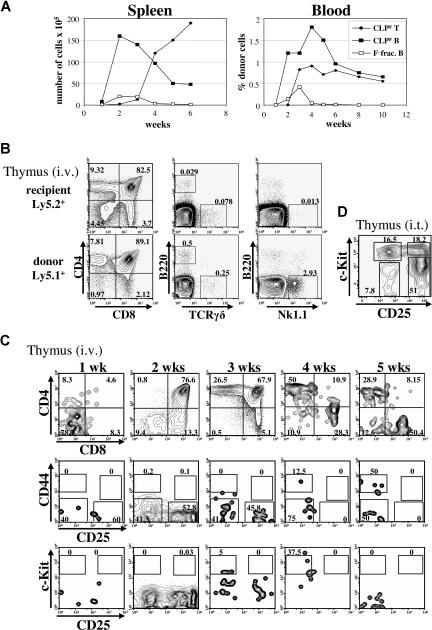
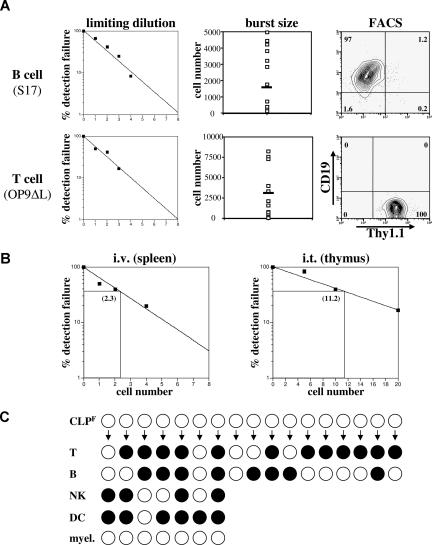
Mature blood cells develop from multipotent hematopoietic stem cells through a series of sequential intermediates in which the developmental potential for particular blood lineages is progressively extinguished. We previously reported the identification of one of these developmental intermediates, the common lymphoid progenitor (CLP), which can give rise to T cells, B cells, dendritic cells (DCs), and natural killer cells (NKs), but lacks myeloid and erythroid potential. Recently, several studies have suggested that the T-cell and DC potential of CLP is limited or absent, and/or that CLP contains significant myeloid potential. Here, we show that the originally identified CLP population can be divided into functionally distinct subsets based on the expression of the tyrosine kinase receptor, Flk2. The Flk2(+) subset contains robust in vivo and in vitro T-cell, B-cell, DC, and NK potential, but lacks myeloid potential and, therefore, represents an oligopotent, lymphoid-restricted progenitor. This population of cells does not appear to be B cell-biased and robustly reconstitutes both B and T lineages in vivo, consistent with its being a physiologic progenitor of both of these subsets. Thus, Flk2 expression defines a homogeneous, readily obtainable subset of bone marrow CLP that is completely lymphoid-committed and can differentiate equivalently well into both B and T lineages.


Figures

Figure 1
Figure 1
CLPs can be divided into Flk2+ and Flk2 fractions. (A) Strategy originally used to isolate CLPs by first gating on LinIL-7Rα+ cells (left panel) and subsequently on c-KitintSca-1int cells (middle panel) reveals heterogeneous expression of Flk2 (right panel). (B) Changing the gating strategy by first gating on lineage negative cells (not shown) reveals 2 distinct IL-7Rα+ populations (left panel). The Flk2+ fraction shows homogeneous expression of c-Kit and Sca-1 (middle panel) whereas the Flk2 fraction shows a more heterogeneous expression pattern (right panel). Numbers on plots are percentages of gated cells. (C) Surface expression of CD27, CD62L and CD93/AA4.1 on CLPF (bold lines) in comparison to MPP (solid thin lines), or isotype controls (dashed lines). (D) FACS plot overlay of CLPF (black dot plot) and lineage negative (excluding B220, gray contour plot) populations in C57Bl/6 BM. AA4.1hi cells are predominantly B220+.
Figure 2
Figure 2
Only CLPF have multilymphoid potential in vivo. (A-D) FACS analysis of spleens 3 weeks after intravenous transplantation of 103 CLPF or CLPF− into Ly5 congenic, sublethally (400 rad) irradiated hosts and control mice that received sham transplants. (A) Host cells are Ly5.1+ whereas donor-derived cells are Ly5.2+. (B,C) FACS plots showing T cell (TCRαβ+), B cell (CD19+), or NK cell (Nk1.1+) cell reconstitution of the spleen after pregating on either Ly5.1+ host cells (left panels) or Ly5.2+ donor-derived cells (middle and right panels). Both Flk2 and Flk2+ CLPs gave rise to B cells but donor-derived T cells and NK cells were only detectable in CLPF reconstituted mice. (D) FACS plots showing absence of myeloid cells (Mac-1+Gr-1+) from donor-derived Flk2 fraction cells or CLPF. (E) Thymi from irradiated (400 rads) host Ly5.2+ animals 3 weeks after intravenous (i.v.) transplantation of 103 CLPF or Flk2 fraction cells in comparison to animals that received sham transplants (PBS) were analyzed for donor derived Ly5.1+ progeny. 3 weeks after transplantation CLPF derived thymocytes were responsible for roughly two-thirds of the thymus cellularity in mice that received transplants whereas the Flk2 fraction yielded no thymic cells. (F) Thymic reconstitution after intrathymic injection of 103 Ly5.1+ CLPF or Flk2 fraction cells into irradiated (400 rads) Ly5.2+ recipient mice. Numbers on plots are percentages of gated cells.
Figure 3
Figure 3
Kinetics of CLPF-driven T cell reconstitution. (A) Kinetic analyses of B-cell (squares) and T-cell (diamonds) reconstitution of spleen (left panel) and blood (right panel) of sublethally irradiated mice that received transplants of 103 CLPF (black) or Flk2 fraction cells (white). Results shown are mean values of 3 to 5 animals analyzed per time point. For blood analysis, the same animals were bled periodically for 10 weeks. (B) FACS plots illustrating the CD4/CD8 profile of host (top row) and CLPF derived donor cells (bottom row) as well as reconstitution with thymic B cells (B220+), γδ T cells, and NK cells showing the lymphoid potential of CLPFs. (C) FACS plots illustrating the T-lineage development of intravenously injected CLPF in the thymus, from 1 to 5 weeks. Detailed analysis of CD4/CD8 development (top row), and within the CD4/CD8 double negative fraction, CD44 and CD25 development (middle row) or CD25 and c-Kit development (bottom row), after previously gating on lineage negative cells. Shown are representative FACS plots from 3 mice that received transplants per time point. (D) Thymic reconstitution 6 days after intrathymic (i.t.) injection transfer of 103 CLPF into congenic unirradiated mice. Events shown are gated on lineage negative donor-derived cells. FACS analysis reveals generation of c-Kithi DN1 (CD25c-Kit+) and c-Kithi DN2(CD25+c-Kit+) directly derived from CLPF. Numbers on plots are percentages of gated cells.
Figure 4
Figure 4
CLPF produce Mac-1+ B1b cells and Mac-1+CD11c+ dendritic cells, but not myeloid cells. (A) Congenic sublethally irradiated mice received transplants of 103 CLPF cells. Three weeks after the transfer spleens were analyzed for donor-derived cells. FACS plots shown are previously gated on recipient (left) or donor-derived cells (right) and are B220CD19Gr-1. Percentage of Mac-1+CD11c+ dendritic cells are shown. (B) Analysis of Mac-1+ B-1b cell differentiation from CLPF in the spleen 4 weeks after transplantation. Cells are pregated on CD5, and the percentage of Mac-1+IgD B-1b cells are shown. Numbers on plots are percentages of gated cells. (C) Methylcellulose myeloid differentiation assay. c-Kit+LinSca-1+Flk2+ (MPPF) cells, CLPF, and Flk2 fraction cells (F frac.) from bone marrow were double sorted and plated out at 100 cells (MPPF) and 500 to 1000 cells (CLPF and F frac.) in triplicates in methyl cellulose medium containing SCF, Flt3L, GM-CSF, Epo, Tpo, IL-3, IL-6, and IL-11. The average number of colonies yielded and their lineage content as colony forming units (CFU) from 2 combined experiments are shown. G, granulocyte; E, erythrocyte; M, macrophage; B, B cell; and Σ, sum.
Figure 5
Figure 5
CLPF clonally give rise to B and T cells. (A) B-cell (top panel) and T-cell (bottom panel) progenitor frequency of CLPF was assessed by culturing them on either S17 (for B cells) and delta-like 1 expressing OP9 (for T cells) stroma cells in the presence of IL-7, SCF, and Flt3L for 10 days in 96-well plates at densities between 0 and 8 cells per well. The left panel shows the percentage of failure of detection of either CD19+ or Thy1.1+ progeny by FACS. The middle panel shows the number of progeny cells obtained from a single CLPF in these assays with the black bar marking the average burst size. Right panel shows a representative CD19/Thy1.1 FACS plot of a B- and T-cell culture. Horizontal bars in the middle panels represent means. Numbers on right plots are percentages of gated cells. (B) Limiting dilution analysis of donor cells after transfer of CLPF into sublethally irradiated hosts. For B cells, CLPF were intravenously injected and spleens analyzed at 4 weeks. For T cells, CLPF were intrathymically injected and thymi analyzed at 4 days after injection. Three to 5 mice per cell dose were analyzed and numbers shown within the plots represent the calculated limiting number. (C) Results of a clonal assay to simultaneously detect all 4 lymphoid lineages from a single cell (for experimental design and technical details, see Figure S3). Positive clones are symbolized by black circles and a negative result by white circles. Of the 17 clones analyzed, each derived from a single CLPF cell, 8 of 17 gave rise to B cells and 12 of 17 to T cells when cultured under appropriate conditions. Of these positive clones a total of 35% showed simultaneous development of T and B cells, demonstrating the bipotential of CLPF. Furthermore, 7 clones of the 17 underwent 3 or more cell divisions and therefore could also be analyzed for NK, DC, and myeloid potential. Whereas 4 of 7 showed NK cell and 6 of 7 DC potential, none of the clones generated any myeloid cells (0/7). Of the 7 clones analyzed for all 4 lymphoid lineages 2 (28%) simultaneously readout all 4 lymphoid lineages, proving that a single CLPF can possess the full lymphoid potential.

References

    1. Kondo M, Wagers AJ, Manz MG, et al. Biology of hematopoietic stem cells and progenitors: implications for clinical application. Annu Rev Immunol. 2003;21:759–806. - PubMed
    1. Akashi K, Traver D, Miyamoto T, Weissman IL. A clonogenic common myeloid progenitor that gives rise to all myeloid lineages. Nature. 2000;404:193–197. - PubMed
    1. Traver D, Akashi K, Manz M, et al. Development of CD8alpha-positive dendritic cells from a common myeloid progenitor. Science. 2000;290:2152–2154. - PubMed
    1. Mende I, Karsunky H, Weissman IL, Engleman EG, Merad M. Flk2+ myeloid progenitors are the main source of Langerhans cells. Blood. 2006;107:1383–1390. - PMC - PubMed
    1. Karsunky H, Merad M, Mende I, Manz MG, Engleman EG, Weissman IL. Developmental origin of interferon-alpha-producing dendritic cells from hematopoietic precursors. Exp Hematol. 2005;33:173–181. - PubMed

Publication types

MeSH terms

Substances