. 2008 May;11(5):565-71.
doi: 10.1038/nn.2110. Epub 2008 Apr 20.

Quantal noise from human red cone pigment

Affiliations

Quantal noise from human red cone pigment

Yingbin Fu et al. Nat Neurosci. 2008 May.

Abstract

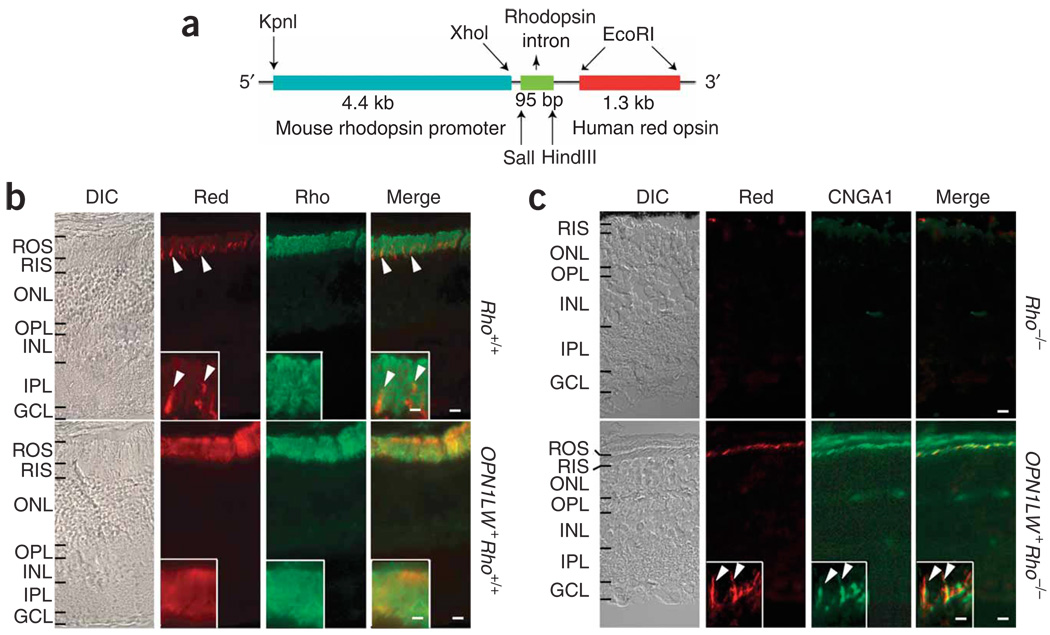
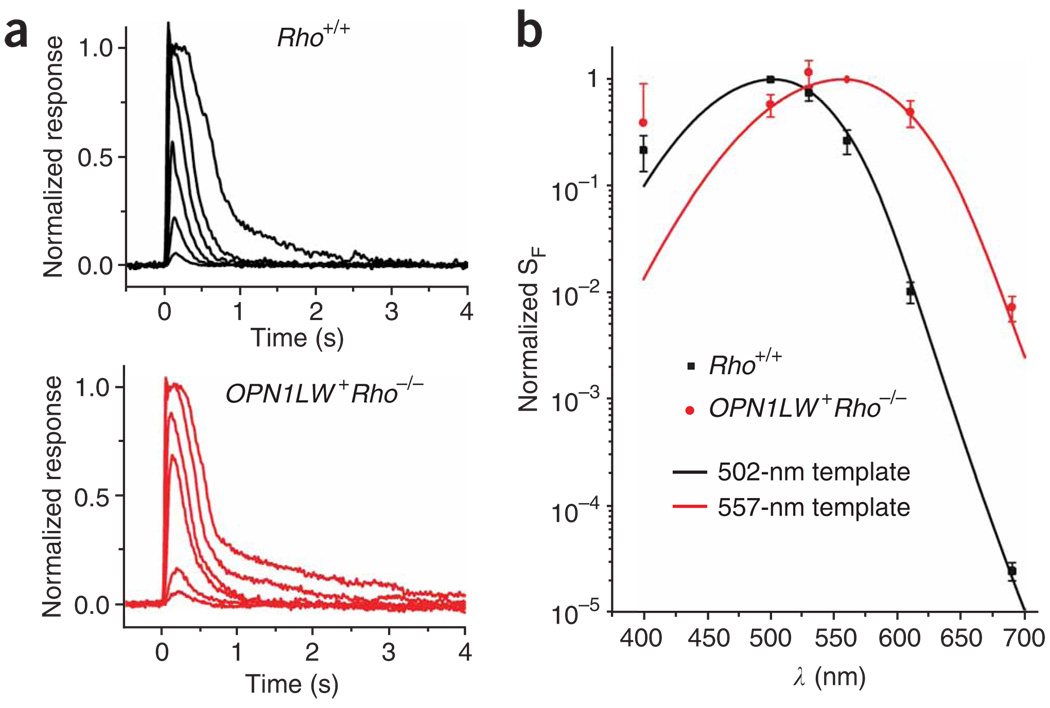
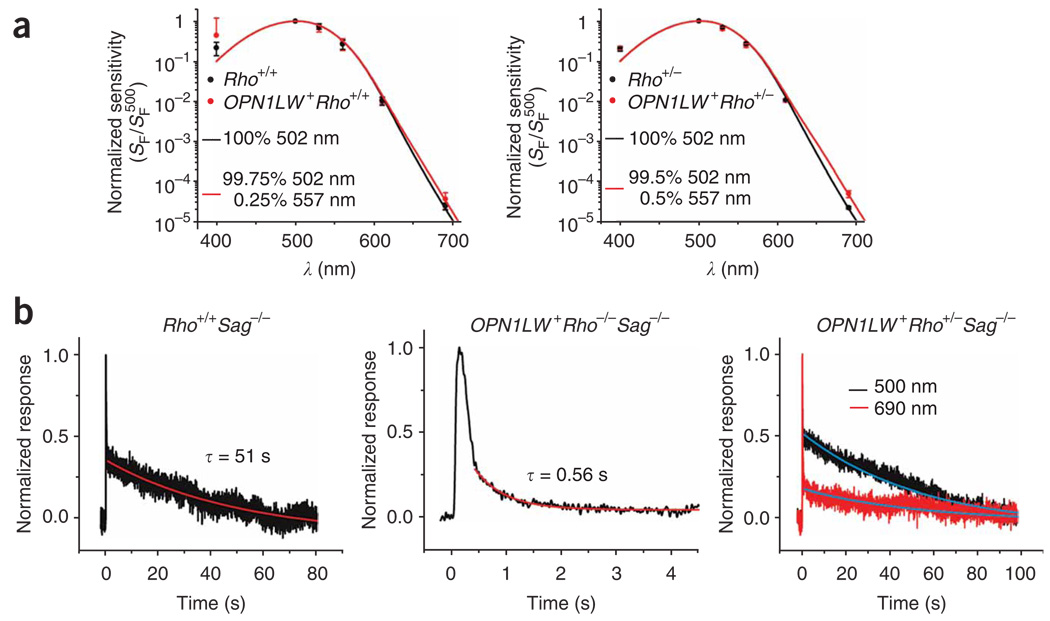
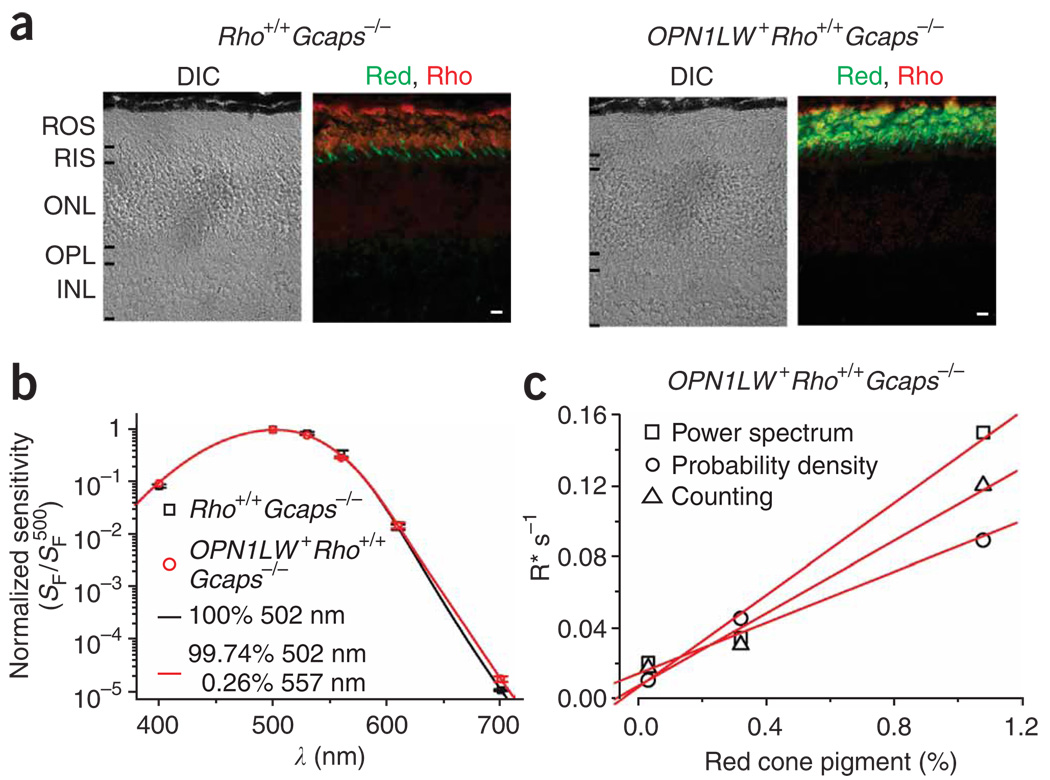
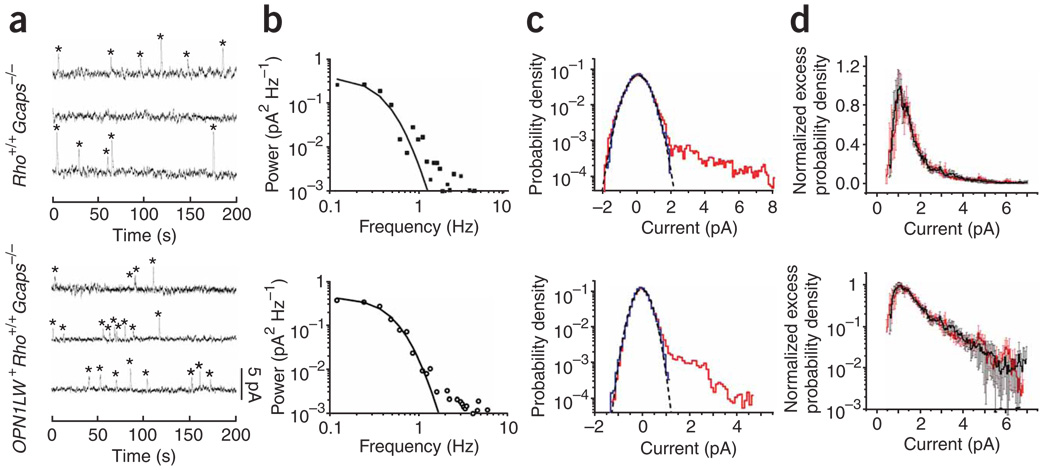
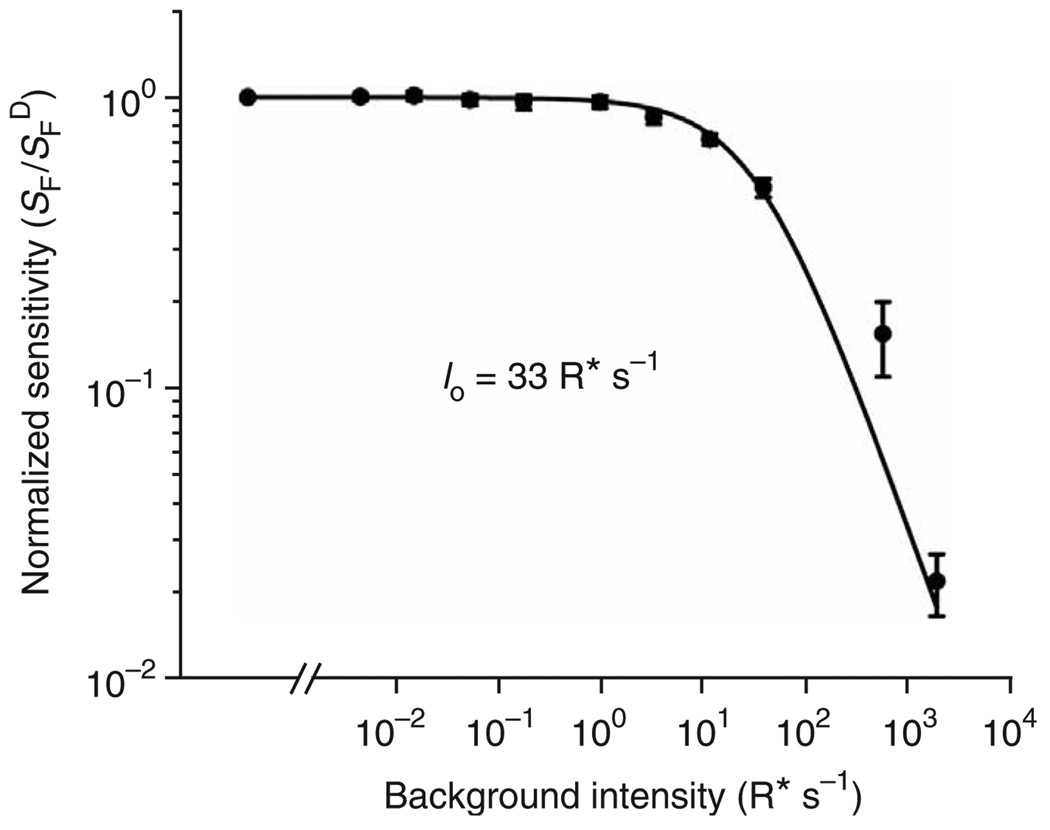
The rod pigment, rhodopsin, shows spontaneous isomerization activity. This quantal noise produces a dark light of approximately 0.01 photons s(-1) rod(-1) in human, setting the threshold for rod vision. The spontaneous isomerization activity of human cone pigments has long remained a mystery because the effect of a single isomerized pigment molecule in cones, unlike that in rods, is small and beyond measurement. We have now overcome this problem by expressing human red cone pigment transgenically in mouse rods in order to exploit their large single-photon response, especially after genetic removal of a key negative-feedback regulation. Extrapolating the measured quantal noise of transgenic cone pigment to native human red cones, we obtained a dark rate of approximately 10 false events s(-1) cone(-1), almost 10(3)-fold lower than the overall dark transduction noise previously reported in primate cones. Our measurements provide a rationale for why mammalian red, green and blue cones have comparable sensitivities, unlike their amphibian counterparts.


Figures

Figure 1
Figure 1
Mouse rods expressing transgenic human red cone pigment. (a) Transgene construct. The 4.4-kb mouse rhodopsin promoter fragment was linked to a 1.3-kb cDNA coding for human red cone opsin. The third intron of the human rhodopsin gene was inserted between the two to improve expression. (b) Frozen sections from Rho+/+ (wild type) and OPN1LW+ Rho+/+ (transgenic) mouse retinas immunostained for red cone pigment (red) and rhodopsin (rho). Arrowheads, sporadic mouse cones (presumably green cones) in Rho+/+ retina cross-labeled by the antibody. Inset, high-magnification view of outer segment layer. DIC, differential interference contrast. (c) Frozen sections from 2-month-old Rho−/− and OPN1LW+ Rho−/− (transgenic without rhodopsin) mouse retinas immunostained for red cone pigment and rod marker CNGA1. Note the absence of an outer segment layer in Rho−/− retina and its presence, although it is thin, in OPN1LW+ Rho−/− retina. Inset, high-magnification view of OPN1LW+Rho−/− rod outer segments with red cone pigment (arrowheads). ROS, rod outer segment; RIS, rod inner segment; ONL, outer nuclear layer; OPL, outer plexiform layer; INL, inner nuclear layer; IPL, inner plexiform layer; GCL, ganglion cell layer. Scale bars: 10 µm in main panels, 2 µm in insets.
Figure 2
Figure 2
Responses and action spectrum of mouse rods expressing transgenic red cone pigment. (a) Flash intensity-response families from Rho+/+ and OPN1LW+ Rho−/− rods. A 20-ms flash at t = 0 s, delivering 7, 37, 123, 472, 1,589 and 10,281 photons (500 nm) per µm2 for Rho+/+ rods (top) and 640, 2,110, 13,339, 43,997, 166,044 and 547,677 photons (560 nm) per µm2 for OPN1LW+ Rho−/− (bottom). (b) Action spectra of Rho+/+ and OPN1LW+ Rho−/− rods, fit by the absorption-spectrum templates for mouse rhodopsin (λmax = 502 nm) and human red cone pigment (λmax = 557 nm), respectively. Averaged data from 10 Rho+/+ rods and 24 OPN1LW+ Rho−/− rods. Error bars, s.e.m. Note that the lack of good fit of the data at 400 nm by the templates was due to the presence of the beta-band (with a peak more blue-shifted than λmax) in pigment absorption, traditionally not considered in the spectral templates.
Figure 3
Figure 3
Estimate of percentage of red cone pigment in transgenic mouse rods. (a) Red shift in action spectrum induced by the presence of human red cone pigment in OPN1LW+Rho+/+ rods (n = 11) compared to Rho+/+ (n = 10) (left), and OPN1LW+ Rho+/− rods (n = 14) compared to Rho+/− (n = 11) (right). Dim-flash sensitivity, SF, was derived from dim flashes at 400, 500, 530, 560, 610 and 690 nm. Error bars, s.e.m. The action spectra are fit by the indicated linear combinations of the spectral templates for rhodopsin and red cone pigment (see Fig. 2b). (b) Averaged flash responses of mouse rods in the absence of arrestin. Left, Rho+/+ Sag−/− rod; 27 flashes, each 25 photons (500 nm) per µm2. Middle, OPN1LW+Rho−/−Sag−/− rod; 30 flashes, each 23,300 photons (560 nm) per µm2. Red traces, single-exponential declines, with time constant τ = 51 s on left and 0.56 s in middle. Right, OPN1LW+ Rho+/–Sag−/− rod. Flashes (15 per wavelength) of 85 photons per µm2 at 500 nm (black) and 696,123 photons per µm2 at 690 nm (red).
Figure 4
Figure 4
Expression of human red cone pigment in Rho+/+ Gcaps−/− background. (a) Retinal cross-sections from 1-month-old Rho+/+Gcaps−/− and OPN1LW+ Rho+/+Gcaps−/− mice. Double immunolabeling with antibodies to red cone pigment (green color) and rhodopsin (red color). Scale bar, 10 µm; abbreviations as in Figure 1. (b) Estimate of percentage of transgenic red cone pigment in OPN1LW+Rho+/+Gcaps−/− rods based on the red-shift in the action spectrum. At each wavelength, the responses to 50 dim 10-ms flashes were averaged. Error bars, s.e.m. Altogether, we studied 13 Rho+/+Gcaps−/− and 16 OPN1LW+ Rho+/+Gcaps−/− rods. Not all indicated wavelengths were examined for every cell, but at least 500 nm and 700 nm were. The wavelengths and the numbers of cells studied (given as λ, number of Rho+/+Gcaps−/− rods, number of OPN1LW+ Rho+/+Gcaps−/− rods) were, for 500 nm, 13, 16; 700 nm, 13, 16; 610 nm, 8, 6; 560 nm, 7, 2; 530 nm, 9, 1; 400 nm, 3, 1. Note that the apparent good fit of the data at 400 nm by the templates was a coincidence (see Fig. 2b legend; compare to Fig. 2b and Fig 3a) owing to only three cells being studied at this wavelength (see Methods). (c) Correlation between cone-pigment expression and the isomerization rate in darkness measured as illustrated in Figure 5 for three OPN1LW+ Rho+/+Gcaps−/− rods from which both parameters were measured. The dark quantal rate included events originating from the endogenous rhodopsin.
Figure 5
Figure 5
Measurement of spontaneous isomerization rate of red cone pigment. (a–c) Top, same Rho+/+ Gcaps−/− rod (control). Bottom, same OPN1LW+ Rho+/+Gcaps−/− rod. See text and Methods for details. (a) Counting method. Sample recordings (continuous in time from top through bottom traces) in darkness showing discrete events (asterisks) identified based on a criterion amplitude of >30% of single-photon response. (b) Method based on power-density spectra. Difference power spectrum (spectrum with events minus spectrum without events) fitted by that for the single-photon response function. (c) Probability density method. Red profile, probability density histogram of overall dark recordings. Bin width, 0.1 pA. Blue profile is that of selected recording segments with no apparent events, scaled to the same height as the red profile. Black dashed curve, scaled gaussian distribution that fits the negative sides of the red and blue histograms. (d) Overlaid (and normalized to the same height) excess probability density histograms averaged from six Rho+/+Gcaps−/− (red) and six OPN1LW+ Rho+/+Gcaps−/− (black) rods to show their identical profiles. Top, linear coordinates; bottom, semilog. Bin width, 0.05 pA; error bars, s.e.m.
Figure 6
Figure 6
Background adaptation of wild-type (Rho+/+) mouse rods. Plot of normalized flash sensitivity against number of isomerizations per second due to background light intensity. Averaged results from 11 cells. Continuous curve is from Weber-Fechner relation, SF = SFD Io/(IB + Io). SFD, flash sensitivity in the absence of background light; SF, flash sensitivity in the presence of a background light IB; Io, the background intensity required to reduce the rod sensitivity to half of its dark value. Error bars, s.e.m. See text for details.

References

    1. Barlow HB. Increment thresholds at low intensities considered as signal/noise discriminations. J. Physiol. (Lond.) 1957;136:469–488. - PMC - PubMed
    1. Barlow HB. Visual Problems of Colour. Vol. II. London: Her Majesty’s Stationery Office; 1958. Intrinsic noise of cones; pp. 617–630. (ed. National Physical Laboratory, Teddington, England)
    1. Donner K. Noise and the absolute thresholds of cone and rod vision. Vision Res. 1992;32:853–866. - PubMed
    1. Field GD, Sampath AP, Rieke F. Retinal processing near absolute threshold: from behaviour to mechanism. Annu. Rev. Physiol. 2005;67:491–514. - PubMed
    1. Baylor DA, Matthews G, Yau K-W. Two components of electrical dark noise in toad rod outer segments. J. Physiol. (Lond.) 1980;309:591–621. - PMC - PubMed

Publication types

LinkOut - more resources