Comparative Study
. 2009 Mar;114(2):287-99.
doi: 10.1007/s10549-008-0017-2. Epub 2008 Apr 19.

Molecular profiles of progesterone receptor loss in human breast tumors

Affiliations
Comparative Study

Molecular profiles of progesterone receptor loss in human breast tumors

Chad J Creighton et al. Breast Cancer Res Treat. 2009 Mar.

Abstract

Background: Patient prognosis and response to endocrine therapy in breast cancer correlate with protein expression of both estrogen receptor (ER) and progesterone receptor (PR), with poorer outcome in patients with ER+/PR- compared to ER+/PR+ tumors.

Methods: To better understand the underlying biology of ER+/PR- tumors, we examined RNA expression (n > 1000 tumors) and DNA copy number profiles from five previously published studies of human breast cancers with clinically assigned hormone receptor status (ER+/PR+, ER+/PR-, and ER-/PR-).

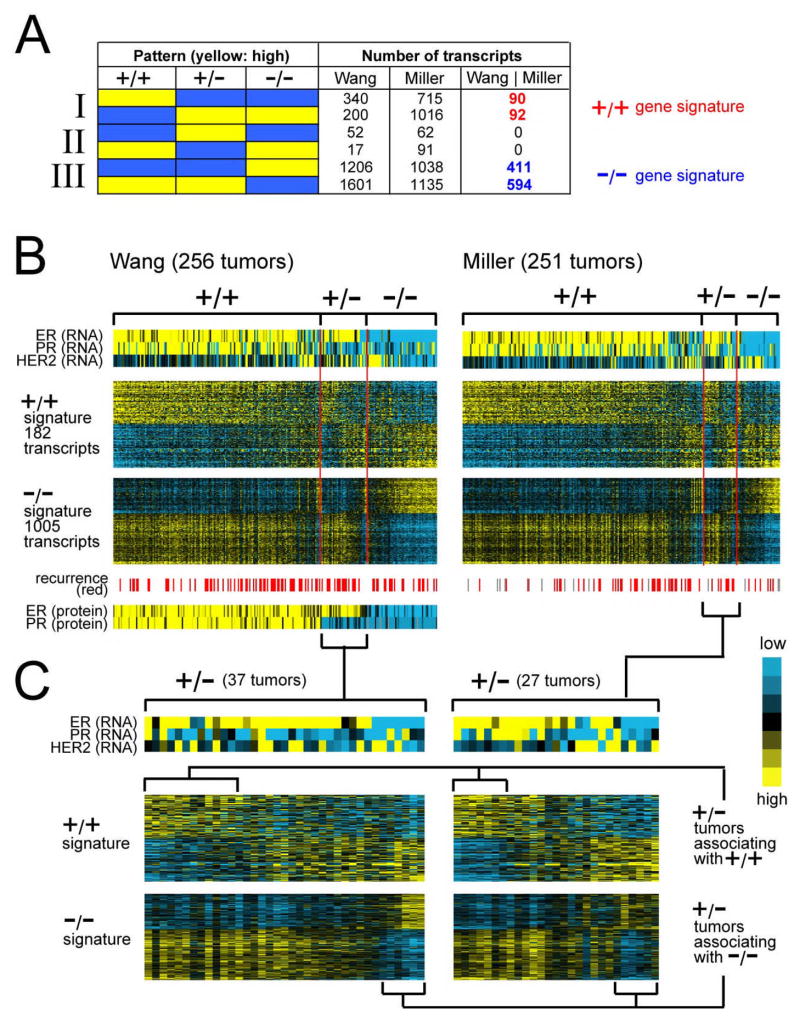
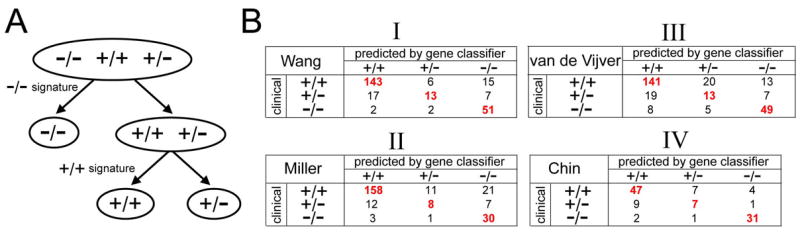
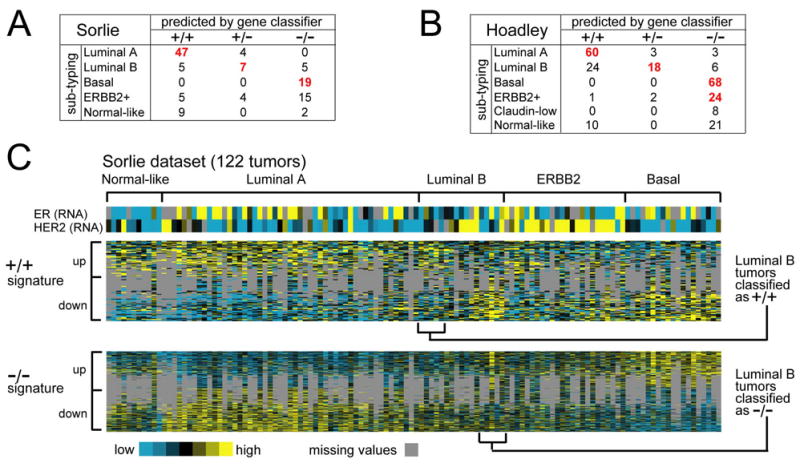
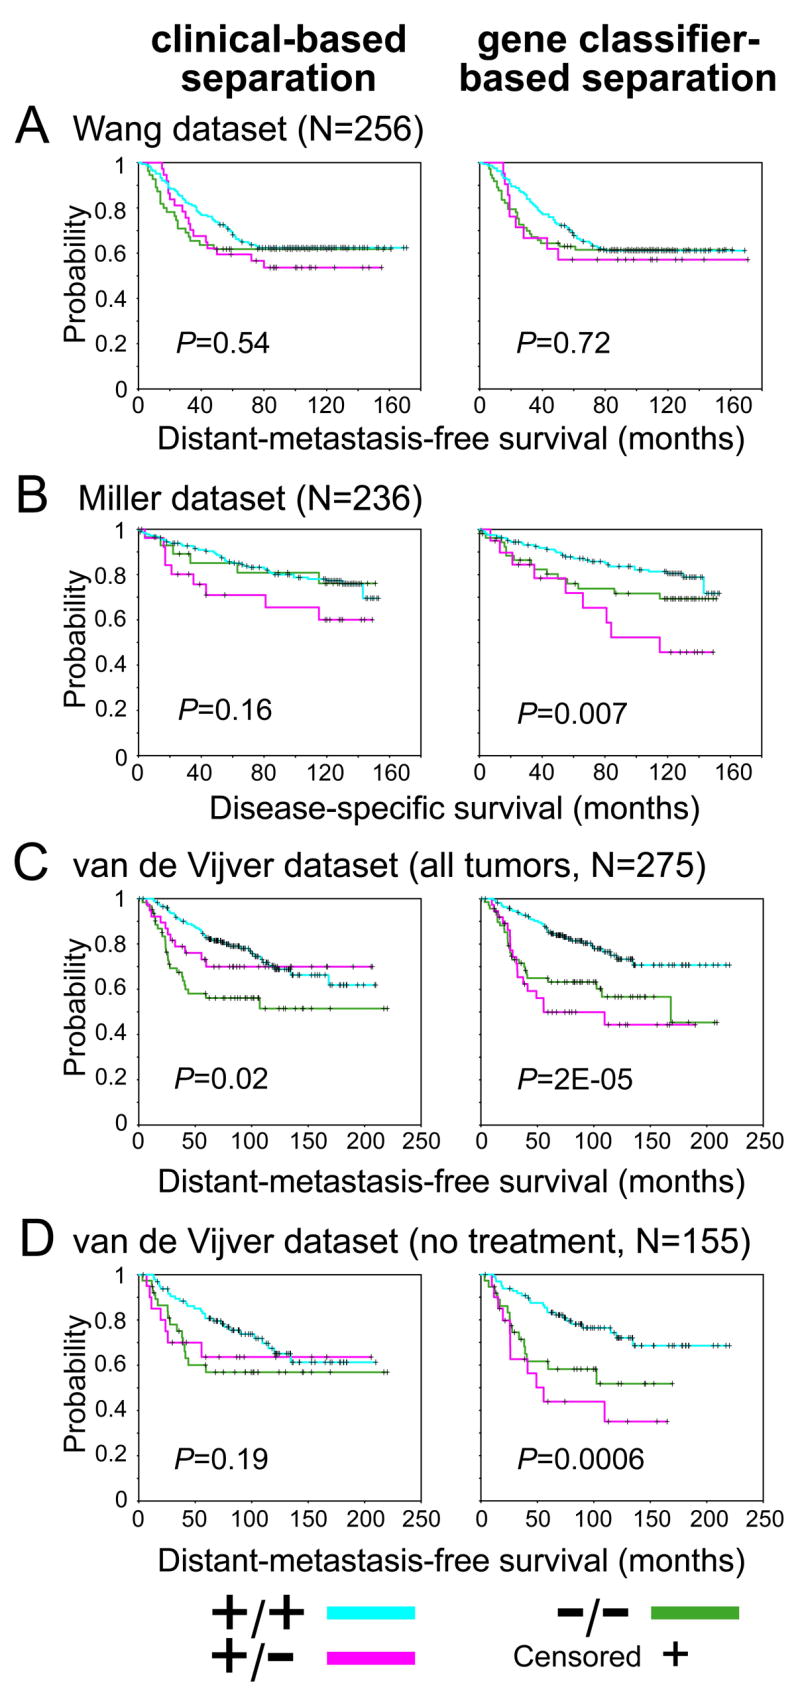
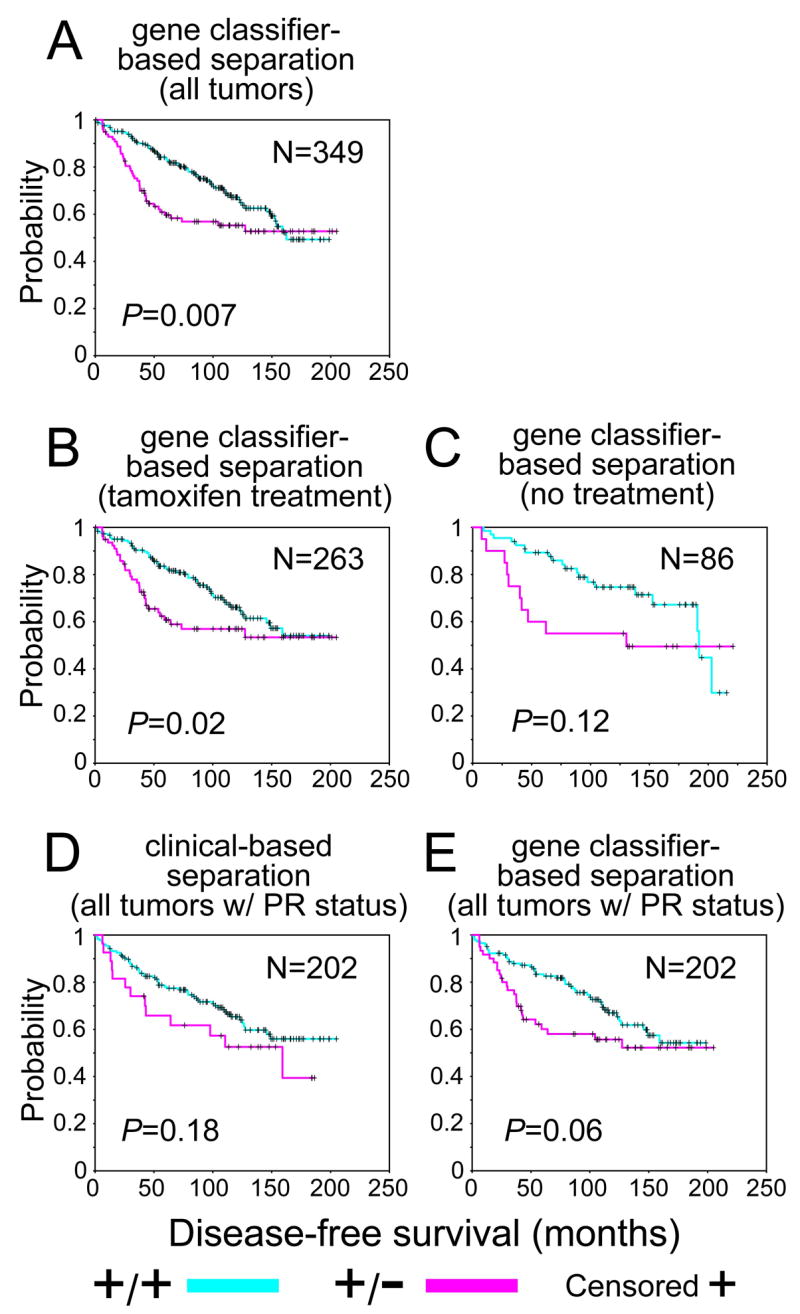
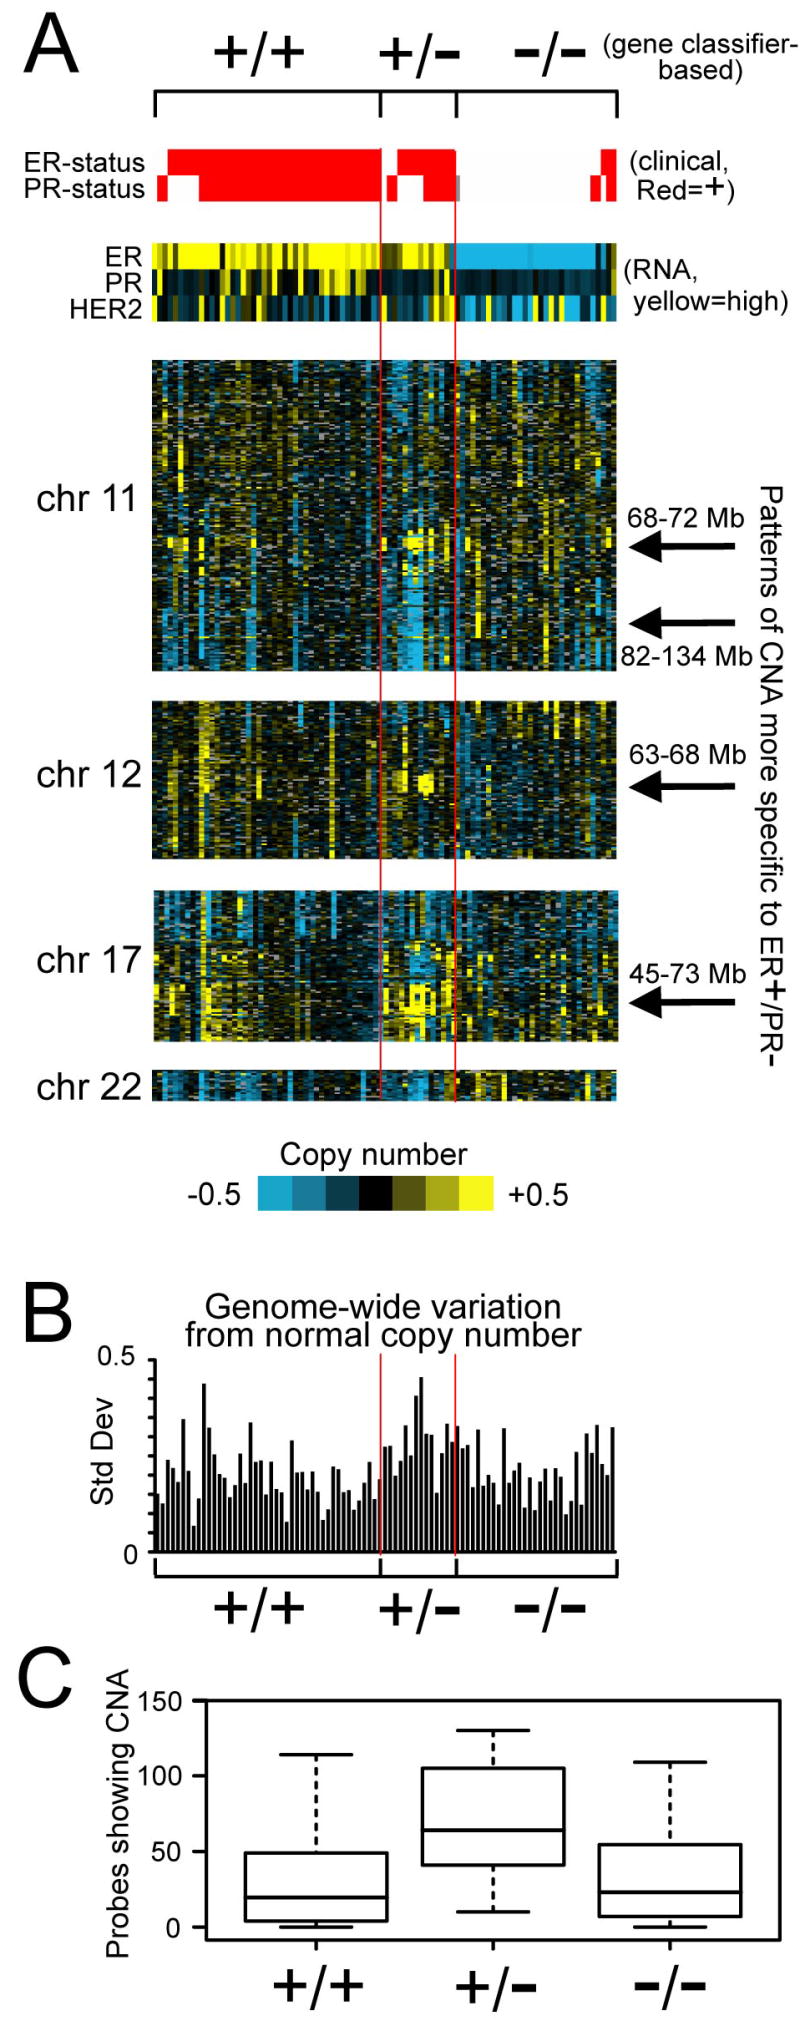
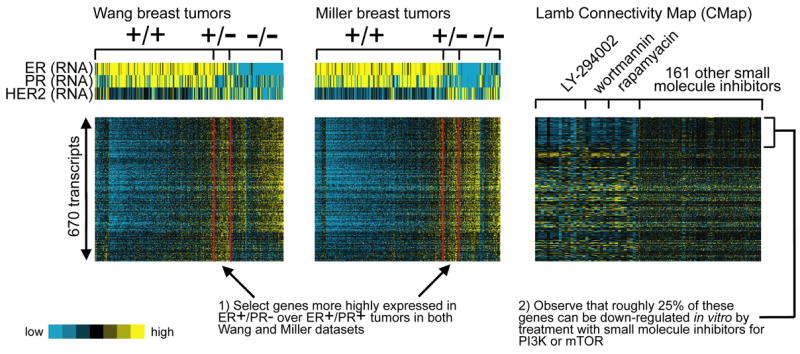
Results: We identified an expression "signature" of genes with either elevated or diminished RNA levels specifically in ER+/PR+ compared to ER-/PR- and ER+/PR- tumors. We similarly identified a gene signature specific to ER-/PR- tumors. ER+/PR- tumors, on the other hand, were a mixture of three different subtypes: tumors manifesting the ER+/PR+ signature, tumors manifesting the ER-/PR- signature, and tumors not associating with ER+/PR+ or ER-/PR- tumors (which we considered "true" ER+/PR-). In analyses of both tamoxifen-treated and untreated patients, ER+/PR- breast cancers defined by RNA profiling were associated with poor patient outcome, worse than those with pure ER+/PR+ patterns; these differences were not observed when using clinical assays to assign ER and PR status. ER+/PR- tumors also showed twice as many DNA copy number gains or losses compared to ER+/PR+ and ER-PR- tumors. Targets of transcriptional up-regulation by specific oncogenic pathways, including PI3 K/Akt/mTOR, were enriched in both ER+/PR- and ER-/PR- compared to ER+/PR+ tumors.

Conclusion: ER+/PR- tumors as defined by RNA profiling represent a distinct subset of breast cancer with aggressive features and poor outcome, despite being clinically ER+. Multigene assays derived from our gene signatures could conceivably provide an improved clinical assay for inferring PR status for prognostic and therapeutic purposes.


Figures

Figure 1
Figure 1
Global gene expression patterns associated with ER+/PR+ (“+/+”), ER+/PR− (“+/−“), and ER−/PR− (“−/−“) clinical assay-assigned human breast tumors. (A) Number of RNA transcripts found over- or under-expressed specifically in one of the three breast tumor subtypes in each of the Wang and Miller expression profile datasets, as well as the number of subtype-specific transcripts common to both datasets (“Wang | Miller”). +/+ gene signature, genes/transcripts expressed specifically in ER+/PR+ compared to both ER+/PR− and ER−/PR− tumors (p < 0.01 each comparison in Wang dataset, p < 0.05 each comparison in Miller dataset). −/− gene signature, genes expressed specifically in ER−/PR− compared to both ER+/PR+ and ER+/PR− tumors. (B) Heat map representation of expression patterns of the ER+/PR+ and ER−/PR− gene signatures in the Wang and Miller profile datasets. Rows of the map represent genes; columns, profiled tumors. Relative expression is represented as colorgram (yellow: high expression). Expression values centered on the mean of the clinical group centroids. RNA expression patterns for genes ER, PR, and HER2 corresponding to the tumors are also indicated, as well as protein expression of ER and PR in the Wang dataset (protein data not available for Miller dataset), and recurrence events (gray: missing data). (C) Heat map representation of ER+/PR+ and ER−/PR− gene signatures in ER+/PR− tumors only (expanded from part B). Profiles were manually sorted to highlight those similar to ER+/PR+ and those similar to ER−/PR− tumors.
Figure 2
Figure 2
Classification of breast tumors into ER+/PR+, ER+/PR−, and ER−/PR− on the basis of gene expression profiles, as compared to clinical assay-based classification. (A) Decision tree for classifying the subtype of a tumor profile using the ER+/PR+ and ER−/PR− gene signatures (Figure 1). (B) Confusion matrices comparing subtype assignments based on gene classifier with the clinical-based assignments in the Wang and Miller datasets used to originally define the signatures (panels I and II, respectively), as well as in additional datasets from van de Vijver et al. [28] and Chin et al. [26] (panels III and IV, respectively), which were not used to define the signatures. Red bold denotes a significant number of assignments of an actual class within a predicted class (p < = 0.002, one-sided Fisher’s exact).
Figure 3
Figure 3
ER+/PR− tumors as defined by gene signatures associate with the luminal B breast cancer molecular subtype. (A) Confusion matrix for the tumor profile dataset from Sorlie et al. [25], comparing subtype assignments using the ER+/PR+ and ER−/PR− gene signatures with the molecular profile subtypes as defined previously by unsupervised analysis. Red bold denotes a significant number of subtype assignments by the gene classifier of Fig. 2a within one of the Sorlie molecular subtypes (P < 0.001, one-sided Fisher’s exact). (B) Confusion matrix for the profile dataset from Hoadley et al. [36]. (C) Heat map of the ER+/PR+ and ER−/PR− gene signatures (100 and 570 genes represented, respectively) in the Sorlie tumor profile dataset (gray: missing data values)
Figure 4
Figure 4
Patients with ER+/PR− breast tumors as defined by gene expression profiling rather than by clinical assay alone tend to have poorer prognosis. Kaplan-Meier analysis of breast cancer patients stratified by ER+/PR+, ER+/PR−, and ER−PR−, where the status was determined by either clinical assay (left panels) or gene classifer (right panels). Profile datasets from Wang (A), Miller (B), and van de Vijver (both all tumors (C), and the subset of tumors that did not receive either hormone therapy or chemotherapy (D), are considered). Log-rank statistic p-values evaluate whether there are significant differences in time to poor outcome event between any of the three groups. For Wang and van de Vijver datasets, measured outcome is distant-metastasis-free survival; for Miller dataset, outcome is disease-specific survival. N, number of patients.
Figure 5
Figure 5
ER+/PR− tumors as defined by gene expression profiling tend to have poorer prognosis in ER+ breast cancer patients receiving tamoxifen hormone monotherapy. Kaplan-Meier analysis of ER+ patients in dataset from Loi et al. [37] stratified by ER+/PR+ and ER+/PR−, where the status was determined by either clinical assay (D) or gene expression profiling (A,B,C,E). For gene classifier-based separation, all patients (A), the subset of patients for which clinical ER and PR status was available (E), and the subset of patients treated with tamoxifen (B) were considered. Outcome is disease-free survival. N, number of patients. P-values by log-rank statistic.
Figure 6
Figure 6
DNA copy number alterations (CNAs) in ER+/PR− breast tumors. (A) Heat map representation of CNA in the Chin tumors within chromosomes 11, 12, 17, and 22. DNA probes are ordered by genome location. Tumors are separated into ER+/PR+, ER+/PR−, and ER−/PR− as defined by gene classifier (see Figure 2A); histology-based ER and PR status are indicated, as well as RNA expression for ER, PR, and HER2. (B) Plot of the standard deviations from normal control across all of the DNA probes for each tumor profile. The ordering of the tumors corresponds to that of part (A). (C) Box plot of the number of DNA probes showing gain or loss of 1.5 times the control among the three tumor groups (as defined by gene classifier), based on 89 DNA copy number profiles from Chin et al. [26].
Figure 7
Figure 7
A gene signature of oncogenic pathway PI3K/Akt/mTOR is manifested in ER+/PR− tumors. Heat map of 670 transcripts more highly expressed in ER+/PR− over ER+/PR+ tumors in both the Wang and Miller datasets (p < 0.01 in each, using the gene signature-based rather than the clinically-based assignments). Alongside the patterns of the clinical breast tumor data are the corresponding expression patterns in a compendium of expression profiles from cell lines treated with 164 different small molecule inhibitors (the “Connectivity Map,” or CMap, from Lamb et al. [42]). Profiles in CMap of cells treated with PI3K inhibitors LY-294002 and wortmannin and the mTOR inhibitor rapamyacin are highlighted.

Similar articles

Cited by

References

    1. Elledge RM, Fuqua SA. Estrogen and progesterone receptors. In: Harris J, Lippman ME, Morrow M, Osborne C, editors. Diseases of the Breast. Philadelphia: Lippincott, Williams and Wilkins; 2000. pp. 471–488.
    1. Cui X, Schiff R, Arpino G, Osborne CK, Lee AV. Biology of progesterone receptor loss in breast cancer and its implications for endocrine therapy. J Clin Oncol. 2005;23 (30):7721–7735. - PubMed
    1. Osborne C. Steroid hormone receptors in breast cancer management. Breast Cancer Res Treat. 1998;51(3):227–238. - PubMed
    1. Allred DC, Brown P, Medina D. The origins of estrogen receptor alpha-positive and estrogen receptor alpha-negative human breast cancer. Breast Cancer Res. 2004;6:240–245. - PMC - PubMed
    1. Poole AJ, Li Y, Kim Y, Lin S-CJ, Lee W-H, Lee EYHP. Prevention of Brca1-mediated mammary tumorigenesis in mice by a progesterone antagonist. Science. 2006;314(5804):1467–1470. - PubMed

Publication types

MeSH terms