

Arterial spin labeling of cerebral perfusion territories using a separate labeling coil
- PMID: 18425844
- PMCID: PMC4987961
- DOI: 10.1002/jmri.21320
Arterial spin labeling of cerebral perfusion territories using a separate labeling coil
Abstract
Purpose: To obtain cerebral perfusion territories of the left, the right, and the posterior circulation in humans with high signal-to-noise ratio (SNR) and robust delineation.
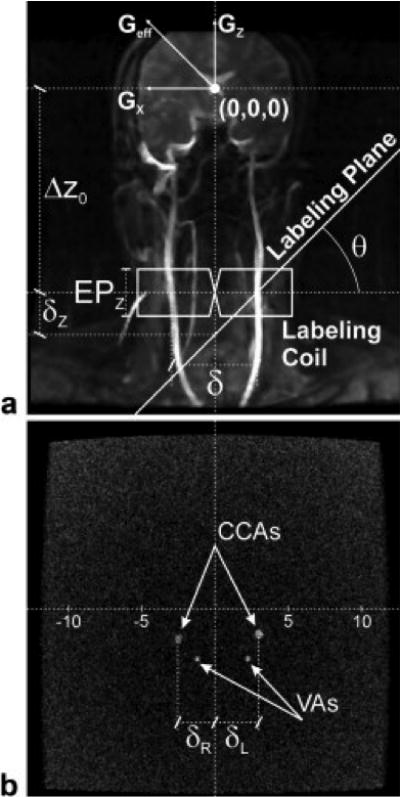
Materials and methods: Continuous arterial spin labeling (CASL) was implemented using a dedicated radio frequency (RF) coil, positioned over the neck, to label the major cerebral feeding arteries in humans. Selective labeling was achieved by flow-driven adiabatic fast passage and by tilting the longitudinal labeling gradient about the Y-axis by theta = +/- 60 degrees .
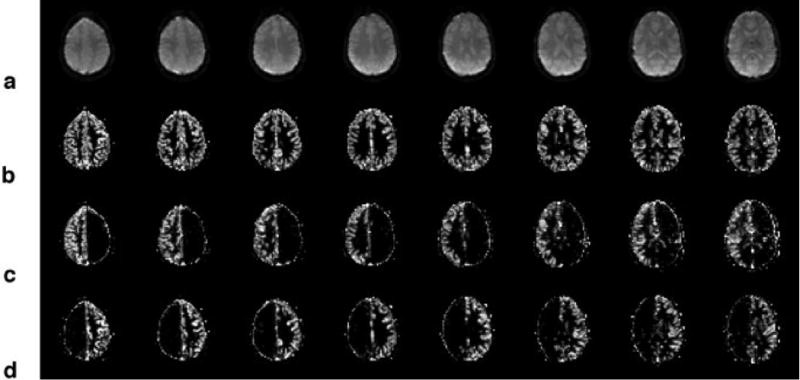
Results: Mean cerebral blood flow (CBF) values in gray matter (GM) and white matter (WM) were 74 +/- 13 mL . 100 g(-1) . minute(-1) and 14 +/- 13 mL . 100 g(-1) . minute(-1), respectively (N = 14). There were no signal differences between left and right hemispheres when theta = 0 degrees (P > 0.19), indicating efficient labeling of both hemispheres. When theta = +60 degrees , the signal in GM on the left hemisphere, 0.07 +/- 0.06%, was 92% lower than on the right hemisphere, 0.85 +/- 0.30% (P < 1 x 10(-9)), while for theta = -60 degrees , the signal in the right hemisphere, 0.16 +/- 0.13%, was 82% lower than on the contralateral side, 0.89 +/- 0.22% (P < 1 x 10(-10)). Similar attenuations were obtained in WM.
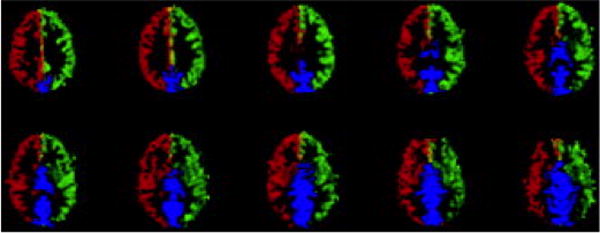
Conclusion: Clear delineation of the left and right cerebral perfusion territories was obtained, allowing discrimination of the anterior and posterior circulation in each hemisphere.
(c) 2008 Wiley-Liss, Inc.
Figures


Similar articles
-
Flow territory mapping of the cerebral arteries with regional perfusion MRI.Stroke. 2004 Apr;35(4):882-7. doi: 10.1161/01.STR.0000120312.26163.EC. Epub 2004 Feb 26. Stroke. 2004. PMID: 14988567
-
Gray matter contamination in arterial spin labeling white matter perfusion measurements in patients with dementia.Neuroimage Clin. 2013 Nov 15;4:139-44. doi: 10.1016/j.nicl.2013.11.003. eCollection 2014. Neuroimage Clin. 2013. PMID: 24371796 Free PMC article.
-
Time-efficient measurement of multi-phase arterial spin labeling MR signal in white matter.NMR Biomed. 2016 Nov;29(11):1519-1525. doi: 10.1002/nbm.3603. Epub 2016 Sep 5. NMR Biomed. 2016. PMID: 27594277
-
Measurement of cerebral perfusion territories using arterial spin labelling.NMR Biomed. 2007 Nov;20(7):633-42. doi: 10.1002/nbm.1177. NMR Biomed. 2007. PMID: 17503440 Free PMC article. Review.
-
Mapping of cerebral perfusion territories using territorial arterial spin labeling: techniques and clinical application.NMR Biomed. 2013 Aug;26(8):901-12. doi: 10.1002/nbm.2836. Epub 2012 Jul 15. NMR Biomed. 2013. PMID: 22807022 Review.
Cited by
-
Bridging the rodent to human translational gap: Marmosets as model systems for the study of Alzheimer's disease.Alzheimers Dement (N Y). 2023 Aug 21;9(3):e12417. doi: 10.1002/trc2.12417. eCollection 2023 Jul-Sep. Alzheimers Dement (N Y). 2023. PMID: 37614242 Free PMC article.
-
Quantitative MRI Measures in SIV-Infected Macaque Brains.J Clin Cell Immunol. 2013;Suppl 7:005. doi: 10.4172/2155-9899.S7-005. J Clin Cell Immunol. 2013. PMID: 24244892 Free PMC article.
-
Perfusion magnetic resonance imaging: a comprehensive update on principles and techniques.Korean J Radiol. 2014 Sep-Oct;15(5):554-77. doi: 10.3348/kjr.2014.15.5.554. Epub 2014 Sep 12. Korean J Radiol. 2014. PMID: 25246817 Free PMC article. Review.
-
Early development of arterial spin labeling to measure regional brain blood flow by MRI.Neuroimage. 2012 Aug 15;62(2):602-7. doi: 10.1016/j.neuroimage.2012.01.005. Epub 2012 Jan 8. Neuroimage. 2012. PMID: 22245338 Free PMC article. Review.
-
Arterial spin labeling measurements of cerebral perfusion territories in experimental ischemic stroke.Transl Stroke Res. 2012 Mar;3(1):44-55. doi: 10.1007/s12975-011-0115-z. Epub 2011 Nov 16. Transl Stroke Res. 2012. PMID: 24323754 Free PMC article.
References
-
- Detre JA, Zhang W, Roberts DA, et al. Tissue specific perfusion imaging using arterial spin labeling. NMR Biomed. 1994;7(1–2):75–82. - PubMed
-
- Golay X, Hendrikse J, Lim TC. Perfusion imaging using arterial spin labeling. Top Magn Reson Imaging. 2004;15(1):10–27. - PubMed
-
- Calamante F, Thomas DL, Pell GS, Wiersma J, Turner R. Measuring cerebral blood flow using magnetic resonance imaging techniques. J Cereb Blood Flow Metab. 1999;19(7):701–735. - PubMed
-
- Barbier EL, Lamalle L, Decorps M. Methodology of brain perfusion imaging. J Magn Reson Imaging. 2001;13(4):496–520. - PubMed
-
- Wintermark M, Sesay M, Barbier E, et al. Comparative overview of brain perfusion imaging techniques. Stroke. 2005;36(9):e83–99. - PubMed
Publication types
MeSH terms
Substances
Grants and funding
LinkOut - more resources
Full Text Sources
