Review
. 2008 Apr;13(2):191-207.
doi: 10.1111/j.1542-474X.2008.00219.x.

Baroreflex sensitivity: measurement and clinical implications

Affiliations
Review

Baroreflex sensitivity: measurement and clinical implications

Maria Teresa La Rovere et al. Ann Noninvasive Electrocardiol. 2008 Apr.

Abstract

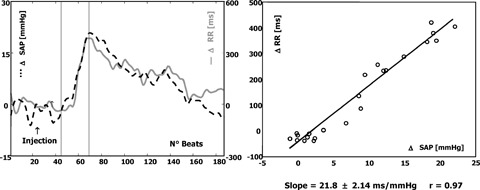
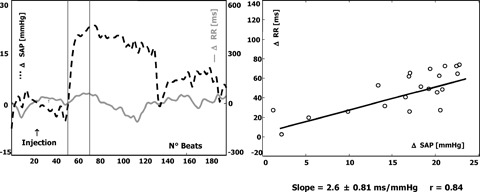
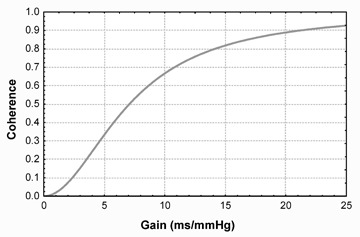
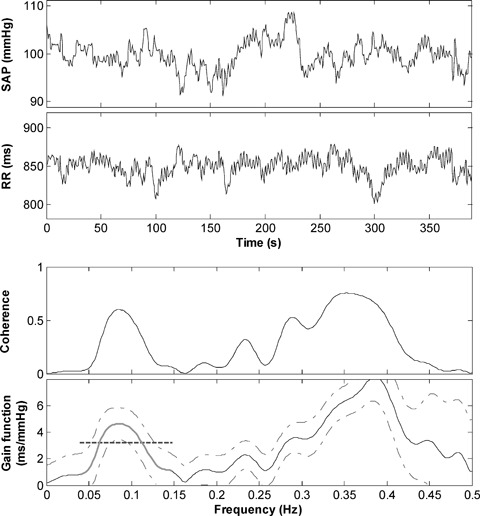
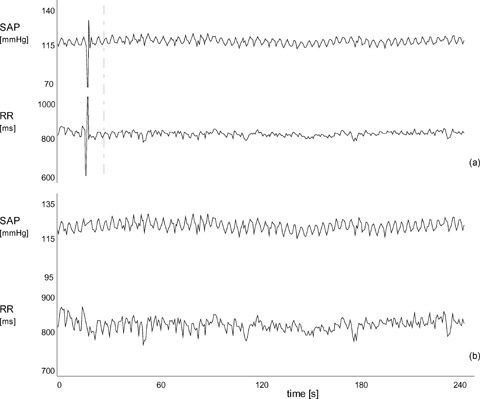
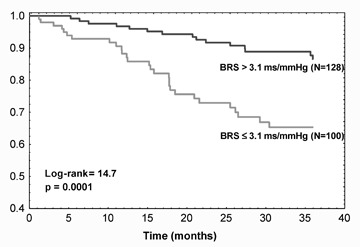
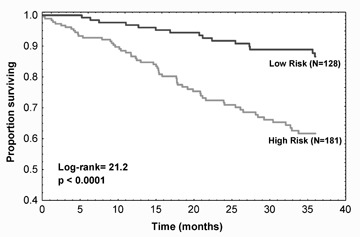
Alterations of the baroreceptor-heart rate reflex (baroreflex sensitivity, BRS) contribute to the reciprocal reduction of parasympathetic activity and increase of sympathetic activity that accompany the development and progression of cardiovascular diseases. Therefore, the measurement of the baroreflex is a source of valuable information in the clinical management of cardiac disease patients, particularly in risk stratification. This article briefly recalls the pathophysiological background of baroreflex control, and reviews the most relevant methods that have been developed so far for the measurement of BRS. They include three "classic" methods: (i) the use of vasoactive drugs, particularly the alpha-adrenoreceptor agonist phenylephrine, (ii) the Valsalva maneuver, which produces a natural challenge for the baroreceptors by voluntarily increasing intrathoracic and abdominal pressure through straining, and (iii) the neck chamber technique, which allows a selective activation/deactivation of carotid baroreceptors by application of a negative/positive pressure to the neck region. Two more recent methods based on the analysis of spontaneous oscillations of systolic arterial pressure and RR interval are also reviewed: (i) the sequence method, which analyzes the relationship between increasing/decreasing ramps of blood pressure and related increasing/decreasing changes in RR interval through linear regression, and (ii) spectral methods, which assess the relationship (in terms of gain) between specific oscillatory components of the two signals. The limitations of the coherence criterion for the computation of spectral BRS are discussed, and recent proposals for overcoming them are presented. Most relevant clinical applications of BRS measurement are finally reviewed with particular reference to patients with myocardial infarction and heart failure.


Figures

Figure 1
Figure 1
Example of a normal BRS. On the left, beat‐to‐beat changes in systolic arterial pressure (SAP) (dotted line) and in RR intervals (solid line) with respect to baseline value are reported. Analysis is performed from the beginning to the end of the increase in SAP with the attendant changes in RR interval (points included between vertical marks). These points are used for calculation of the regression line (on the right). The increase in SAP, >20 mmHg, is associated with an increase in RR interval of about 400 ms. The calculated slope is 21.8 ms/ mmHg increase in SAP. Such a slope identifies a baroreceptor response characterized by a prevailing increase in vagal efferent neural traffic to the sinoatrial node.
Figure 2
Figure 2
Example of a poor BRS. Detailed description as in Figure 2. The increase in SAP is accompanied by a limited change in RR interval and the calculated slope (lower than 3 ms/mmHg) identifies a response characterized by weak vagal reflexes or the inability of vagal reflexes to counterbalance increased sympathetic activity.
Figure 3
Figure 3
Behavior of the coherence between systolic arterial pressure and the RR interval as function of the gain of the baroreflex (modified from reference 17).
Figure 4
Figure 4
Representative example of computation of BRS according to the modified transfer function method in a post‐MI patient. From the top: (a) systolic arterial pressure (SAP) time series; (b) RR time series; (c) coherence function between SAP and HP; (d) modulus of the transfer function (gain function) between SAP and RR (solid line) with 95% confidence interval (dashed‐dotted lines). The bold region of the gain function represents its portion spanning the entire LF band (0.04 ÷ 0.15 Hz), which is averaged to compute BRS (dashed segment).
Figure 5
Figure 5
Representative example of the dramatic effect that a single isolated ectopic beat and its correction may have in the measurement of BRS according to the modified transfer function method. Tracings (a) show systolic arterial pressure (SAP) and RR interval time series with a ventricular premature complex at the beginning of the recording. Measurement of BRS on these signals gives 1.2 ms/mmHg, while excluding the ectopic beat from the computation gives 6.2 ms/mmHg. Tracings (b) show the same signals after correction of the ectopic beat by linear interpolation. Despite the apparent negligible effect on the fluctuation pattern of the two signals, BRS becomes 4.7 ms/mmHg, that is –24% compared to the measurement obtained without the ectopic beat (from ref. 55).
Figure 6
Figure 6
Kaplan‐Meier survival curves according to dichotomized baroreflex sensitivity obtained noninvasively by the modified transfer function method (from reference 55).
Figure 7
Figure 7
Kaplan‐Meier survival curves according to the risk index obtained combining the information on the value of BRS obtained by the modified transfer function method and the information on missing measurement due to severe ectopic activity. Patients at high risk are those with a depressed BRS (≤3.1 ms/mmHg) or a missing BRS due to ectopic beats. Patients at low risk are those with a preserved BRS (>3.1 ms/mmHg) (from reference 55).

References

    1. Eckberg DL, Sleight P. Human Baroreflexes in Health and Disease. In: Eckberg DL, Sleight P, (eds): Oxford , Clarendon Press, 1992.
    1. Cowley AW Jr, Liard JF, Guyton AC. Role of baroreceptor reflex in daily control of arterial blood pressure and other variables in dogs. Circ Res 1973;32:564–576. - PubMed
    1. Kirchheim HR. Systemic arterial baroreceptor reflexes. Physiol Rev 1976;56:100–177. - PubMed
    1. Abboud FM, Thames MD. Interaction of cardiovascular reflexes in circulatory control In: Shepherd JT, Abboud FM. (eds): The Cardiovascular System. Bethesda, MD , American Physiological Society, 1983; pp. 675–754.
    1. Coleman TG. Arterial baroreflex control of heart rate in the conscious rat. Am J Physiol 1980;238:H515–H520. - PubMed