

CRP and adiponectin and its oligomers in the metabolic syndrome: evaluation of new laboratory-based biomarkers
- PMID: 18426744
- PMCID: PMC2664630
- DOI: 10.1309/RN84K51B2JJY1Y0B
CRP and adiponectin and its oligomers in the metabolic syndrome: evaluation of new laboratory-based biomarkers
Abstract
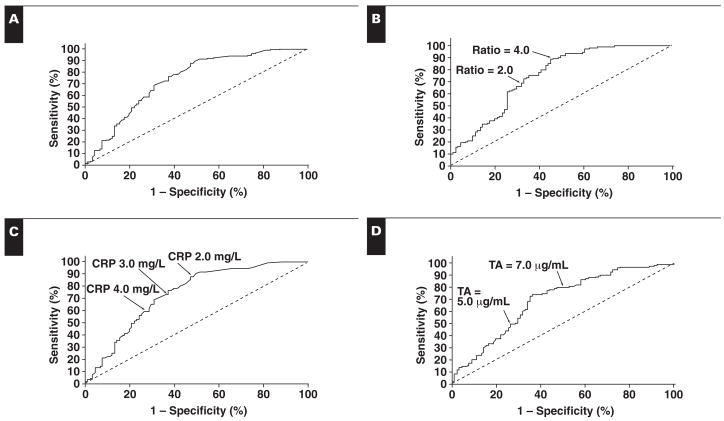
The metabolic syndrome (MetS) confers an increased risk for diabetes and cardiovascular disease. Although high-sensitive C-reactive protein (hsCRP) concentrations are higher and adiponectin concentrations lower in MetS, there is no reliable biochemical measure that can capture its various features. We evaluated whether hsCRP, adiponectin, or the ratio of adiponectin or its oligomers, especially the high-molecular-weight (HMW) oligomer, to hsCRP predict MetS in 123 subjects with MetS compared with that in 91 healthy control subjects. MetS subjects had significantly higher hsCRP levels and lower total adiponectin and oligomer levels relative to control subjects (P < .0001). The HMW/total adiponectin and adiponectin/CRP ratios were significantly lower in MetS subjects than control subjects (P < .005). The odds ratio (OR) of MetS using the 75th percentile cutoff for CRP was 3.8 (95% confidence interval [CI], 2.1-6.8) and equivalent to low total adiponectin (OR, 2.5; 95% CI, 1.3-4.5), its oligomers, or the adiponectin/ hsCRP ratio (OR, 2.6; 95% CI, 1.5, 4.8). Thus, measurements of CRP, adiponectin, or its oligomers provide robust biomarkers for predicting MetS.
Figures
Similar articles
-
Usefulness of C-reactive protein to high-molecular-weight adiponectin ratio to predict insulin resistance and metabolic syndrome in Japanese men.J Atheroscler Thromb. 2010 Sep 30;17(9):944-52. doi: 10.5551/jat.4234. Epub 2010 Jun 11. J Atheroscler Thromb. 2010. PMID: 20543521
-
Chemerin Ratios to HDL-cholesterol and Adiponectin as Biomarkers of Metabolic Syndrome.Endocr Res. 2020 Nov;45(4):241-245. doi: 10.1080/07435800.2020.1811724. Epub 2020 Aug 24. Endocr Res. 2020. PMID: 32835545
-
Comprehensive analysis of circulating adipokines and hsCRP association with cardiovascular disease risk factors and metabolic syndrome in Arabs.Cardiovasc Diabetol. 2014 Apr 9;13:76. doi: 10.1186/1475-2840-13-76. Cardiovasc Diabetol. 2014. PMID: 24716628 Free PMC article. Clinical Trial.
-
Neutrophil and monocyte ratios to high-density lipoprotein-cholesterol and adiponectin as biomarkers of nascent metabolic syndrome.Horm Mol Biol Clin Investig. 2020 Mar 13;41(2). doi: 10.1515/hmbci-2019-0070. Horm Mol Biol Clin Investig. 2020. PMID: 32167929
-
Association of C-reactive protein, interleukin-1 receptor antagonist and adiponectin with the metabolic syndrome.Mediators Inflamm. 2007;2007:93573. doi: 10.1155/2007/93573. Mediators Inflamm. 2007. PMID: 18288276 Free PMC article.
Cited by
-
The Reversal Intervention for Metabolic Syndrome (TRIMS) study: rationale, design, and baseline data.Trials. 2011 May 4;12:107. doi: 10.1186/1745-6215-12-107. Trials. 2011. PMID: 21542913 Free PMC article. Clinical Trial.
-
Human C-reactive protein and the metabolic syndrome.Curr Opin Lipidol. 2009 Jun;20(3):182-9. doi: 10.1097/MOL.0b013e32832ac03e. Curr Opin Lipidol. 2009. PMID: 19369869 Free PMC article. Review.
-
Plasma Neuregulin 4 Levels Are Associated with Metabolic Syndrome in Patients Newly Diagnosed with Type 2 Diabetes Mellitus.Dis Markers. 2018 Mar 12;2018:6974191. doi: 10.1155/2018/6974191. eCollection 2018. Dis Markers. 2018. PMID: 29721105 Free PMC article.
-
Serum Adiponectin and Indices of Cardiovascular Risk in Young Women with Excessive Body Mass.EJIFCC. 2010 Oct 29;21(3):68-73. eCollection 2010 Oct. EJIFCC. 2010. PMID: 27683376 Free PMC article.
-
Circulating angiopoietin-like protein 8 (betatrophin) association with HsCRP and metabolic syndrome.Cardiovasc Diabetol. 2016 Feb 5;15:25. doi: 10.1186/s12933-016-0346-0. Cardiovasc Diabetol. 2016. PMID: 26850725 Free PMC article.
References
-
- Reaven GM. The insulin resistance syndrome: definition and dietary approaches to treatment. Ann Rev Nutr. 2005;25:391–406. - PubMed
-
- Devaraj S, Rosenson RS, Jialal I. Metabolic syndrome: an appraisal of the pro-inflammatory and procoagulant status. Endocrinol Metab Clin North Am. 2004;33:431–453. - PubMed
-
- Ridker PM, Wilson PW, Grundy SM. Should C-reactive protein be added to metabolic syndrome and to assessment of global cardiovascular risk? Circulation. 2004;109:2818–2825. - PubMed
-
- Ridker PM, Buring JE, Cook NR, et al. C-reactive protein, the metabolic syndrome, and risk of incident cardiovascular events: an 8-year follow-up of 14719 initially healthy American women. Circulation. 2003;107:391–397. - PubMed
-
- Rutter MK, Meigs JB, Sullivan LM, et al. C-reactive protein, the metabolic syndrome, and prediction of cardiovascular events in the Framingham Offspring Study. Circulation. 2004;110:380–385. - PubMed
Publication types
MeSH terms
Substances
Grants and funding
LinkOut - more resources
Full Text Sources
Other Literature Sources
Medical
Research Materials
Miscellaneous
