. 2008 Aug;49(8):1658-69.
doi: 10.1194/jlr.M800046-JLR200. Epub 2008 Apr 19.

L-4F treatment reduces adiposity, increases adiponectin levels, and improves insulin sensitivity in obese mice

Affiliations

L-4F treatment reduces adiposity, increases adiponectin levels, and improves insulin sensitivity in obese mice

Stephen J Peterson et al. J Lipid Res. 2008 Aug.

Abstract

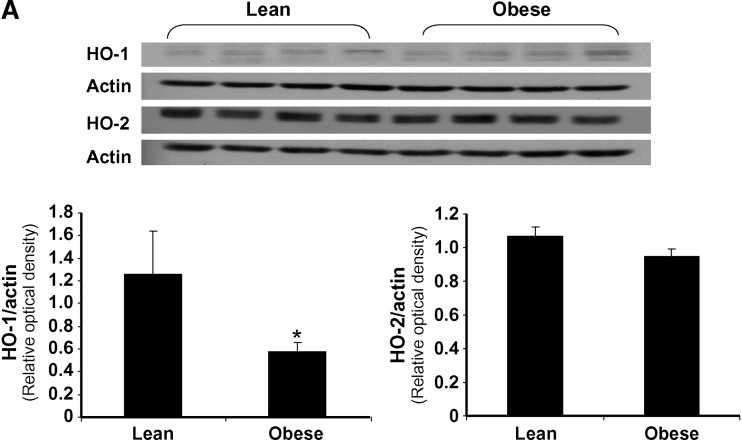
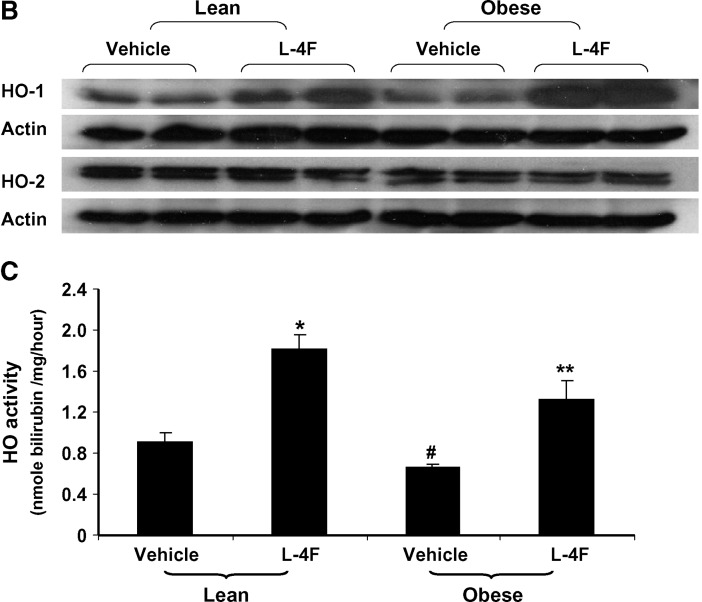
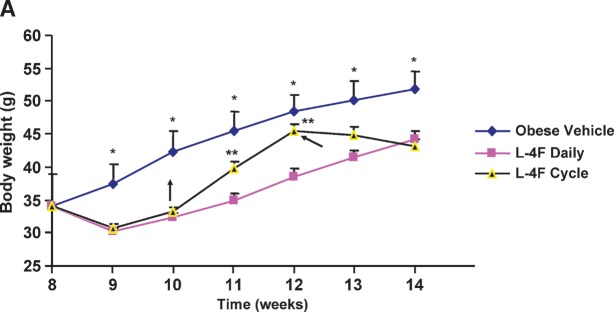
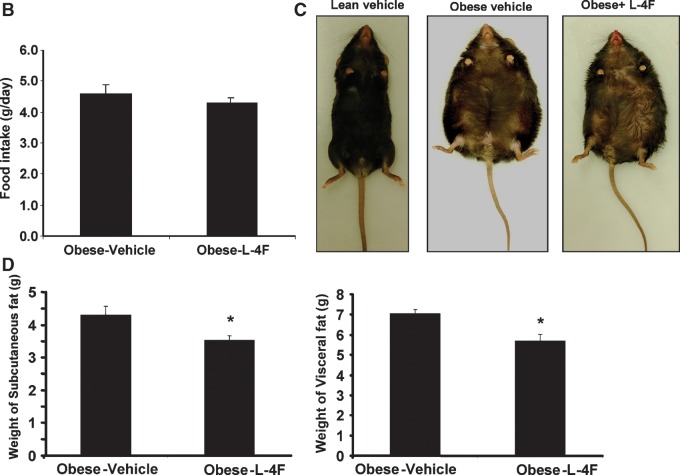
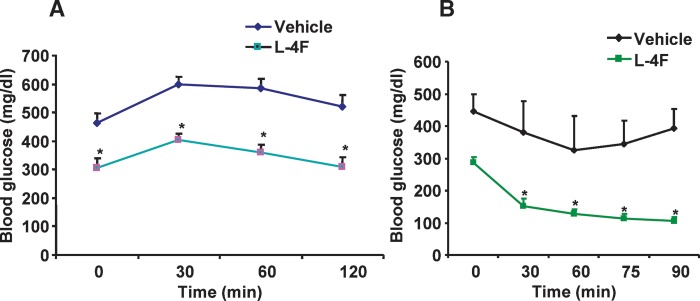
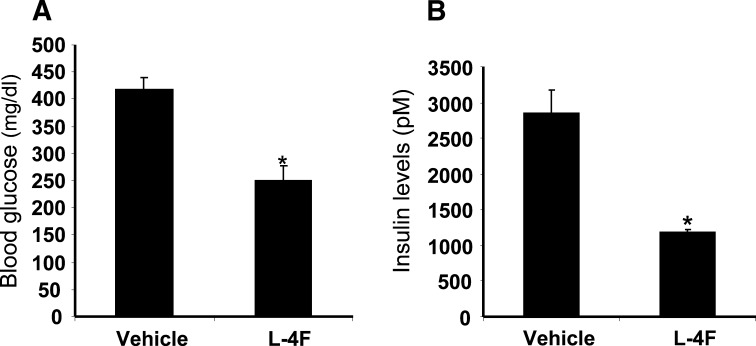
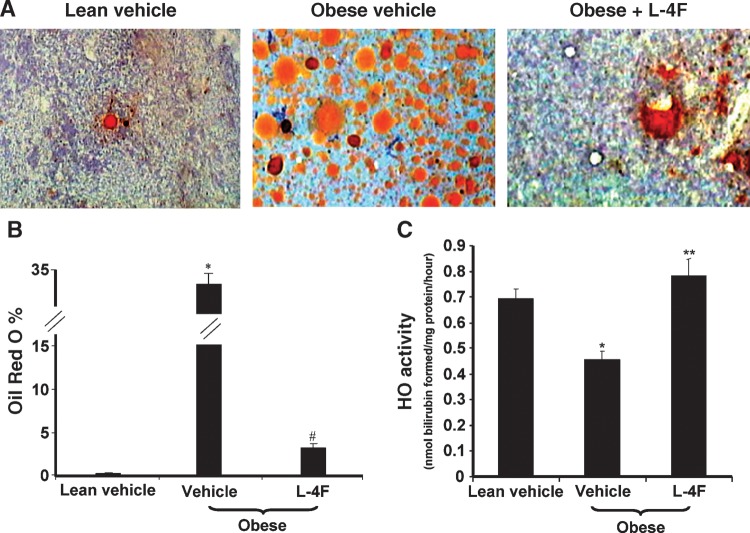
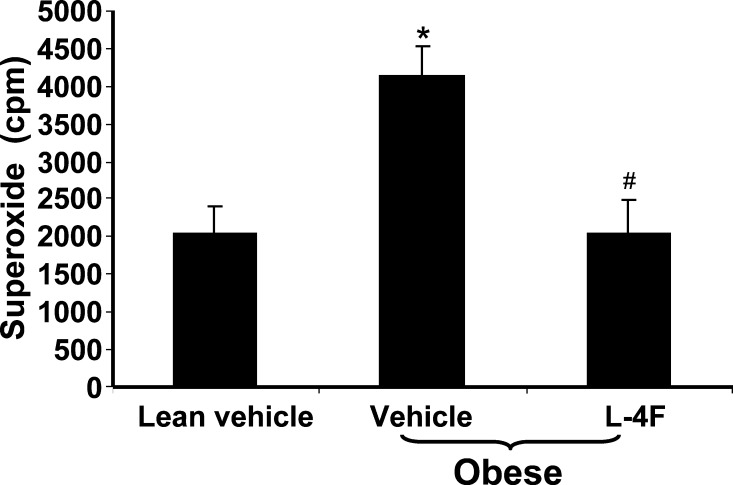
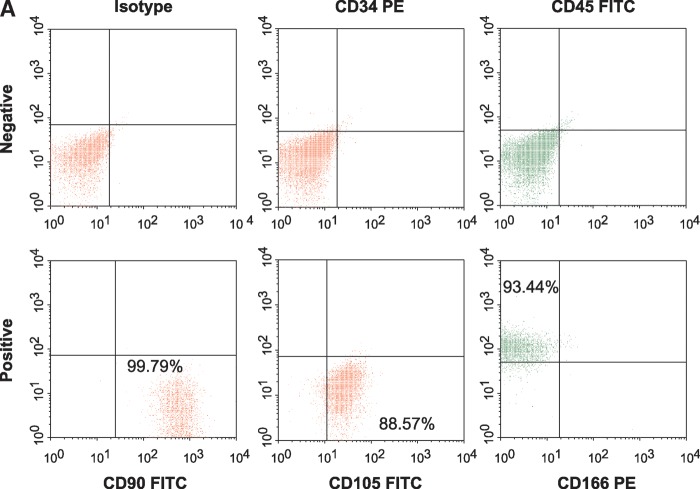
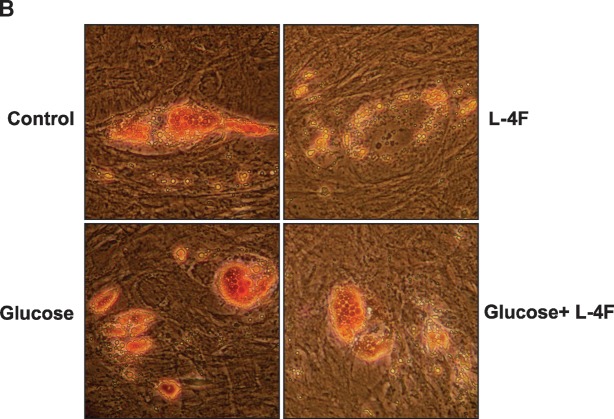
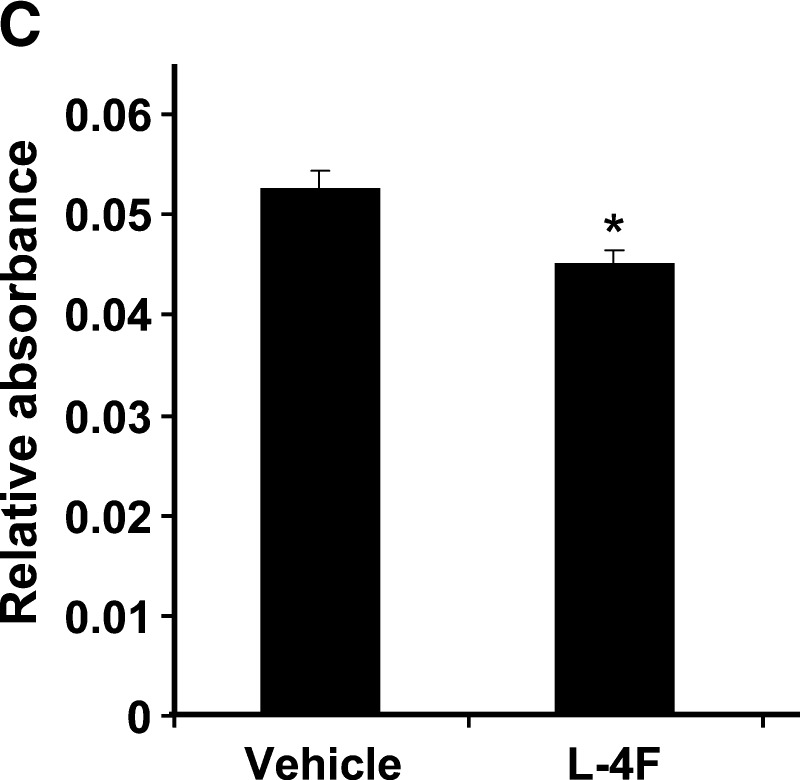
We hypothesized that the apolipoprotein mimetic peptide L-4F, which induces arterial anti-oxidative enzymes and is vasoprotective in a rat model of diabetes, would ameliorate insulin resistance and diabetes in obese mice. L-4F (2 mg/kg/d) administered to ob/ob mice for 6 weeks limited weight gain without altering food intake, decreased visceral (P < 0.02) and subcutaneous (P < 0.045) fat content, decreased plasma IL-1beta and IL-6 levels (P < 0.05) and increased insulin sensitivity, resulting in decreased glucose (P < 0.001) and insulin (P < 0.036) levels. In addition, L-4F treatment increased aortic and bone marrow heme oxygenase (HO) activity and decreased aortic and bone marrow superoxide production (P < 0.001). L-4F treatment increased serum adiponectin levels (P < 0.037) and decreased adipogenesis in mouse bone marrow (P < 0.039) and in cultures of human bone marrow-derived mesenchymal stem cells (P < 0.022). This was manifested by reduced adiposity, improved insulin sensitivity, improved glucose tolerance, increased plasma adiponectin levels, and reduced IL-1beta and IL-6 levels in obese mice. This study highlights the existence of a temporal relationship between HO-1 and adiponectin that is positively affected by L-4F in the ob/ob mouse model of diabetes, resulting in the amelioration of the deleterious effects of diabetes.


Figures

Fig. 1.
Fig. 1.
Effect of L-4F on HO-1 and HO-2 expression in the aorta of lean and obese mice. A: Basal levels of HO-1 and HO-2 in lean and obese mice. Aorta samples were subjected to Western blotting for the determination of HO-1 and HO-2 protein expression. *P < 0.05 lean versus obese. B: Effect of daily administration of L-4F for 6 weeks on HO-1 and HO-2. The gels were scanned and the results expressed as the ratio of HO-1 to actin, n = 6. C:Effect of L-4F and vehicle on HO activity in the aorta of lean and obese mice. HO activity was determined in samples prepared from aorta as described in Materials and Methods. *P < 0.002 vehicle-treated lean versus L-4F-treated lean mice; #P < 0.05 lean vehicle-treated versus obese vehicle-treated mice; **P < 0.03 obese vehicle-treated versus L-4F-treated obese mice.
Fig. 1.
Fig. 1.
Effect of L-4F on HO-1 and HO-2 expression in the aorta of lean and obese mice. A: Basal levels of HO-1 and HO-2 in lean and obese mice. Aorta samples were subjected to Western blotting for the determination of HO-1 and HO-2 protein expression. *P < 0.05 lean versus obese. B: Effect of daily administration of L-4F for 6 weeks on HO-1 and HO-2. The gels were scanned and the results expressed as the ratio of HO-1 to actin, n = 6. C:Effect of L-4F and vehicle on HO activity in the aorta of lean and obese mice. HO activity was determined in samples prepared from aorta as described in Materials and Methods. *P < 0.002 vehicle-treated lean versus L-4F-treated lean mice; #P < 0.05 lean vehicle-treated versus obese vehicle-treated mice; **P < 0.03 obese vehicle-treated versus L-4F-treated obese mice.
Fig. 2.
Fig. 2.
A: Adiponectin levels in lean and obese mice. Vehicle or vehicle containing L-4F was administered daily for 6 weeks (as described in Materials and Methods), and serum samples were obtained immediately prior to euthanization. The results are expressed as μg/ml serum. *P < 0.027 vehicle-treated lean versus vehicle-treated obese mice; #P < 0.04 L-4F-treated obese versus vehicle-treated obese mice. B, C: Serum IL-1β and IL-6 levels in lean and obese mice. Vehicle or vehicle containing L-4F was administered as described in Materials and Methods. Serum samples were obtained immediately prior to euthanization. B:The results for lean vehicle-treated or obese L-4F-treated versus obese vehicle-treated mice for IL-1β; *P < 0.02 vehicle-treated obese versus vehicle-treated lean mice; #P < 0.05 L-4F-treated obese versus vehicle-treated obese mice. C: The results for lean vehicle-treated or obese L-4F-treated versus obese vehicle-treated mice for IL-6; *P < 0.05 vehicle-treated obese versus vehicle-treated lean mice; #P < 0.05 L-4F-treated obese versus vehicle-treated obese mice. Results are shown as the mean ± SEM.
Fig. 3.
Fig. 3.
A: Body weight of vehicle-treated or L-4F-treated obese mice. The mice were weighed at the times shown on the X-axis given as the age of the mice in weeks. The data are the weights in grams as mean ± SEM (average of two independent experiments); n = 8 for vehicle-treated and n = 10 for L-4F-treated, L-4F discontinued, L-4F recommended. *P < 0.05 obese vehicle-treated versus obese L-4F-treated mice. **P < 0.05 compared to continuous administration of L-4F. B: Food intake in vehicle-treated or L-4F-treated obese mice during the first 2 weeks of treatment. C: Representative photographs of mice after 6 weeks of treatment. D: Weight of subcutaneous and visceral fat after L-4F treatment; *P < 0.05 versus vehicle-treated obese animals.
Fig. 3.
Fig. 3.
A: Body weight of vehicle-treated or L-4F-treated obese mice. The mice were weighed at the times shown on the X-axis given as the age of the mice in weeks. The data are the weights in grams as mean ± SEM (average of two independent experiments); n = 8 for vehicle-treated and n = 10 for L-4F-treated, L-4F discontinued, L-4F recommended. *P < 0.05 obese vehicle-treated versus obese L-4F-treated mice. **P < 0.05 compared to continuous administration of L-4F. B: Food intake in vehicle-treated or L-4F-treated obese mice during the first 2 weeks of treatment. C: Representative photographs of mice after 6 weeks of treatment. D: Weight of subcutaneous and visceral fat after L-4F treatment; *P < 0.05 versus vehicle-treated obese animals.
Fig. 4.
Fig. 4.
A: Glucose tolerance and insulin sensitivity after treatment with vehicle or vehicle containing L-4F. After 6 weeks of treatment with vehicle or vehicle containing L-4F, obese mice were injected intraperitoneally with 2 g/kg of glucose, and plasma glucose levels were determined as described in Materials and Methods for the intraperitoneal glucose tolerance test. *P < 0.05 versus vehicle-treated obese mice. B: After 6 weeks of treatment with vehicle or vehicle containing L-4F, obese mice were injected intraperitoneally with 2.0 U/kg of insulin, and plasma glucose levels were determined as described in Materials and Methods for the intraperitoneal insulin tolerance test. *P < 0.001 versus L-4F-treated obese mice, 0 min. The results are expressed as mean ± SEM; n = 4.
Fig. 5.
Fig. 5.
Plasma glucose and insulin levels in vehicle-treated obese mice and L-4F-treated obese mice after 6 weeks of treatment. A: Glucose levels in vehicle-treated obese and L-4F-treated obese mice after 6 weeks of treatment; *P < 0.002 vehicle-treated obeseversus L-4F-treated obese mice. B: Insulin levels in vehicle-treated obese mice and L-4F-treated obese mice after 6 weeks of treatment; *P < 0.036 vehicle-treated obese versus L-4F-treated obese mice. Glucose and insulin levels were measured before euthanization as described in Materials and Methods. Data are shown as the mean ± SEM; n = 5 for vehicle-treated and n = 7 for L-4F-treated obese mice.
Fig. 6.
Fig. 6.
Adiposity and HO-1 activity in bone marrow. A: Representative sections of bone marrow stained to reveal lipid droplets as described in Materials and Methods are shown for vehicle-treated lean mice (left panel), vehicle-treated obese mice (middle panel), and L-4F-treated obese mice (right panel) after 6 weeks of treatment. B: The percentage of bone marrow area with Oil Red O staining was calculated by measuring 10 fields for each sample at a magnification of ×20 as described in Materials and Methods. *P < 0.001 vehicle-treated obese mice versus vehicle-treated lean mice; #P < 0.05 vehicle-treated obese versus L-4F-treated obese mice. C: Bone marrow cells were harvested, and cell lysate was prepared using cell lysis buffer as described in Materials and Methods. HO activity was determined as described in Materials and Methods. *P < 0.014 vehicle-treated obese mice versus vehicle-treated lean mice; **P < 0.014 vehicle-treated obese mice versus L-4F-treated obese mice.
Fig. 7.
Fig. 7.
Effect of L-4F on superoxide levels. Visceral fat was harvested and pooled to isolate adipocytes and O2 levels were determined as described in Materials and Methods. The data shown are mean ± SEM; n = 4. *P < 0.03 vehicle-treated lean mice versus vehicle-treated obese mice; #P < 0.039 vehicle-treated obese mice versus L-4F-treated obese mice.
Fig. 8.
Fig. 8.
A: Surface expression of CD90, CD105, and CD166 on human MSCs (hMSCs) as determined by fluorescence-activated cell sorting analysis. Percent of cells expressing positive markers CD90 (Thy-1), CD105 (endoglin and SH2), and CD166 (ALCAM, activated leukocyte cell adhesion molecule) were 99.8%, 88.6%, and 93.4%, respectively. CD45 (common lymphocytes antigen) and CD34 (hematopoietic stem cell marker) were used as negative markers. CD45 and CD34 were expressed in less than 0.2% of cells, the same as unstained isotypes. B, C: Effect of L-4F on human MSC-derived adipogenesis. B: Oil Red O staining of hMSC cultures 10 days after induction of conditions favoring adipogenesis. Human MSCs were cultured in the presence and absence of high glucose and in the presence and absence of L-4F (20 μg/ml) and subjected to Oil Red O staining as described in Materials and Methods. C: Oil Red O stain was extracted and quantified by relative absorbance as described in Materials and Methods, confirming that L-4F treatment significantly reduced adipogenesis. The values shown are the mean ± SEM, n = 6; *P < 0.022 vehicle-treated hMSC versus L-4F-treated hMSC.
Fig. 8.
Fig. 8.
A: Surface expression of CD90, CD105, and CD166 on human MSCs (hMSCs) as determined by fluorescence-activated cell sorting analysis. Percent of cells expressing positive markers CD90 (Thy-1), CD105 (endoglin and SH2), and CD166 (ALCAM, activated leukocyte cell adhesion molecule) were 99.8%, 88.6%, and 93.4%, respectively. CD45 (common lymphocytes antigen) and CD34 (hematopoietic stem cell marker) were used as negative markers. CD45 and CD34 were expressed in less than 0.2% of cells, the same as unstained isotypes. B, C: Effect of L-4F on human MSC-derived adipogenesis. B: Oil Red O staining of hMSC cultures 10 days after induction of conditions favoring adipogenesis. Human MSCs were cultured in the presence and absence of high glucose and in the presence and absence of L-4F (20 μg/ml) and subjected to Oil Red O staining as described in Materials and Methods. C: Oil Red O stain was extracted and quantified by relative absorbance as described in Materials and Methods, confirming that L-4F treatment significantly reduced adipogenesis. The values shown are the mean ± SEM, n = 6; *P < 0.022 vehicle-treated hMSC versus L-4F-treated hMSC.

References

    1. Robertson R. P. 2004. Chronic oxidative stress as a central mechanism for glucose toxicity in pancreatic islet beta cells in diabetes. J. Biol. Chem. 279 42351–42354. - PubMed
    1. Wellen K. E., and G. S. Hotamisligil. 2005. Inflammation, stress, and diabetes. J. Clin. Invest. 115 1111–1119. - PMC - PubMed
    1. Bahia L., L. G. Aguiar, N. Villela, D. Bottino, A. F. Godoy-Matos, B. Geloneze, M. Tambascia, and E. Bouskela. 2006. Relationship between adipokines, inflammation, and vascular reactivity in lean controls and obese subjects with metabolic syndrome. Clinics. 61 433–440. - PubMed
    1. Kruger A. L., S. Peterson, S. Turkseven, P. M. Kaminski, F. F. Zhang, S. Quan, M. S. Wolin, and N. G. Abraham. 2005. D-4F induces heme oxygenase-1 and extracellular superoxide dismutase, decreases endothelial cell sloughing, and improves vascular reactivity in rat model of diabetes. Circulation. 111 3126–3134. - PubMed
    1. Bakkaloglu S. A., O. Soylemezoglu, N. Buyan, S. O. Oktar, T. Funahashi, H. Pasaoglu, A. H. Elhan, H. Peru, and E. Hasanoglu. 2006. Adiponectin levels and arteriosclerotic risk factors in pediatric renal transplant recipients. Pediatr. Transplant. 10 187–192. - PubMed

Publication types

MeSH terms