

Different strategies for screening and prevention of type 2 diabetes in adults: cost effectiveness analysis
- PMID: 18426840
- PMCID: PMC2394709
- DOI: 10.1136/bmj.39545.585289.25
Different strategies for screening and prevention of type 2 diabetes in adults: cost effectiveness analysis
Abstract
Objective: To compare four potential screening strategies, and subsequent interventions, for the prevention and treatment of type 2 diabetes: (a) screening for type 2 diabetes to enable early detection and treatment, (b) screening for type 2 diabetes and impaired glucose tolerance, intervening with lifestyle interventions in those with a diagnosis of impaired glucose tolerance to delay or prevent diabetes, (c) as for (b) but with pharmacological interventions, and (d) no screening.
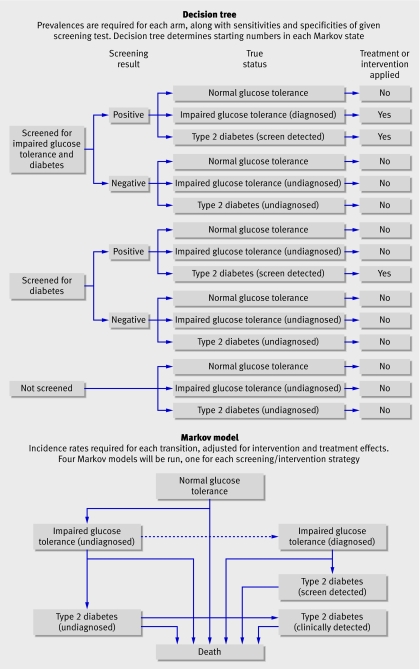
Design: Cost effectiveness analysis based on development and evaluation of probabilistic, comprehensive economic decision analytic model, from screening to death.
Setting: A hypothetical population, aged 45 at time of screening, with above average risk of diabetes.
Data sources: Published clinical trials and epidemiological studies retrieved from electronic bibliographic databases; supplementary data obtained from the Department of Health statistics for England and Wales, the screening those at risk (STAR) study, and the Leicester division of the ADDITION study.
Methods: A hybrid decision tree/Markov model was developed to simulate the long term effects of each screening strategy, in terms of both clinical and cost effectiveness outcomes. The base case model assumed a 50 year time horizon with discounting of both costs and benefits at 3.5%. Sensitivity analyses were carried out to investigate assumptions of the model and to identify which model inputs had most impact on the results.
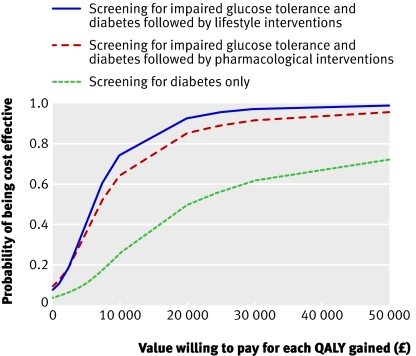
Results: Estimated costs for each quality adjusted life year (QALY) gained (discounted at 3.5% a year for both costs and benefits) were pound14,150 (euro17 560; $27,860) for screening for type 2 diabetes, pound6242 for screening for diabetes and impaired glucose tolerance followed by lifestyle interventions, and pound7023 for screening for diabetes and impaired glucose tolerance followed by pharmacological interventions, all compared with no screening. At a willingness-to-pay threshold of pound20,000 the probability of the intervention being cost effective was 49%, 93%, and 85% for each of the active screening strategies respectively.
Conclusions: Screening for type 2 diabetes and impaired glucose tolerance, with appropriate intervention for those with impaired glucose tolerance, in an above average risk population aged 45, seems to be cost effective. The cost effectiveness of a policy of screening for diabetes alone, which offered no intervention to those with impaired glucose tolerance, is still uncertain.
Conflict of interest statement
Competing interests: MJD and KK have received sponsorship for attending conferences and small honorariums and funding for research from pharmaceutical companies that manufacture hypoglycaemic and anti-obesity drugs. KRA has also received funding for research from pharmaceutical companies that manufacture hypoglycaemic and anti-obesity drugs and has acted as a paid consultant to consultancy companies who undertake work for the healthcare industry generally.
Figures
Comment in
-
Screening for and prevention of type 2 diabetes.BMJ. 2008 May 24;336(7654):1140-1. doi: 10.1136/bmj.39553.480706.80. Epub 2008 Apr 21. BMJ. 2008. PMID: 18426839 Free PMC article.
-
Screening for type 2 diabetes: Screen women with gestational diabetes for type 2 diabetes.BMJ. 2008 Jun 7;336(7656):1263. doi: 10.1136/bmj.a243. BMJ. 2008. PMID: 18535038 Free PMC article. No abstract available.
References
-
- Wild S, Roglic G, Green A, Sicree R, King H. Global prevalence of diabetes: estimates for the year 2000 and projections for 2030. Diabetes Care 2004;27:1047-53. - PubMed
-
- UK National Screening Committee. Handbook for vascular risk assessment, risk reduction and risk management Leicester: University of Leicester, 2008
-
- King H, Aubert RE, Herman WH. Global burden of diabetes, 1995-2025: prevalence numerical estimates, and projections. Diabetes Care 1998;21:1414-31. - PubMed
-
- DECODE study group, European Diabetes Epidemiology Group. Glucose tolerance and mortality: comparison of WHO and American Diabetes Association diagnostic criteria. Diabetes epidemiology: collaborative analysis of diagnostic criteria in Europe. Lancet 1999;354:617-21. - PubMed
Publication types
MeSH terms
Substances
Grants and funding
LinkOut - more resources
Full Text Sources
Medical