. 2008 Apr 21;181(2):335-50.
doi: 10.1083/jcb.200705060.

Remodeling of cellular cytoskeleton by the acid sphingomyelinase/ceramide pathway

Affiliations

Remodeling of cellular cytoskeleton by the acid sphingomyelinase/ceramide pathway

Youssef H Zeidan et al. J Cell Biol. .

Abstract

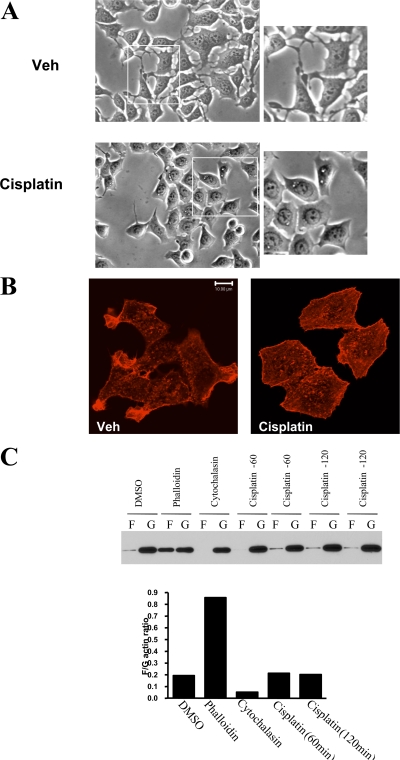
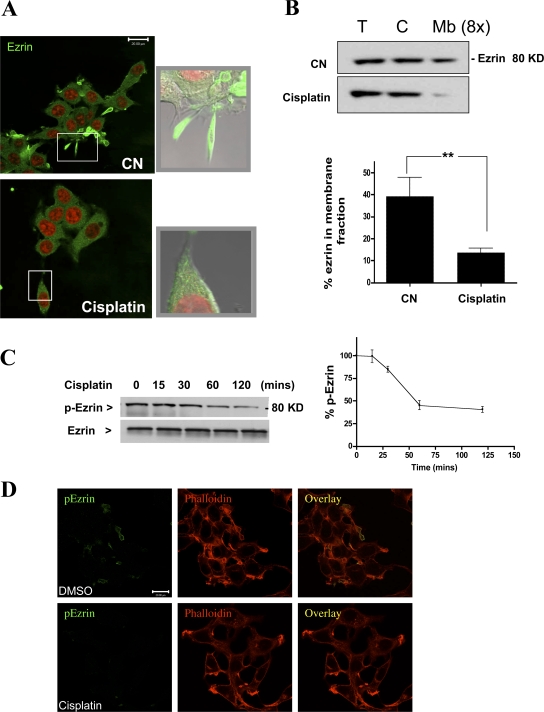
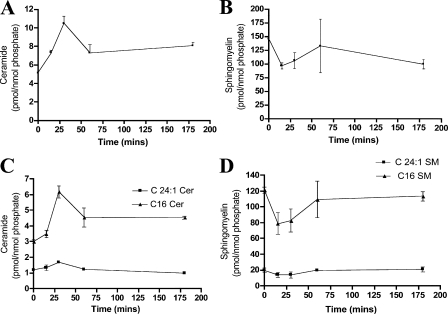
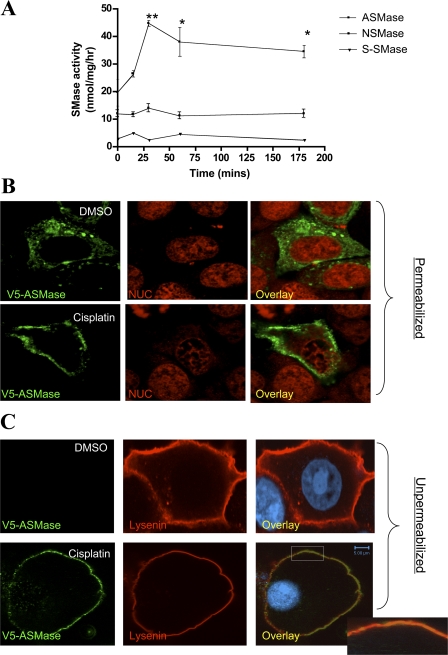
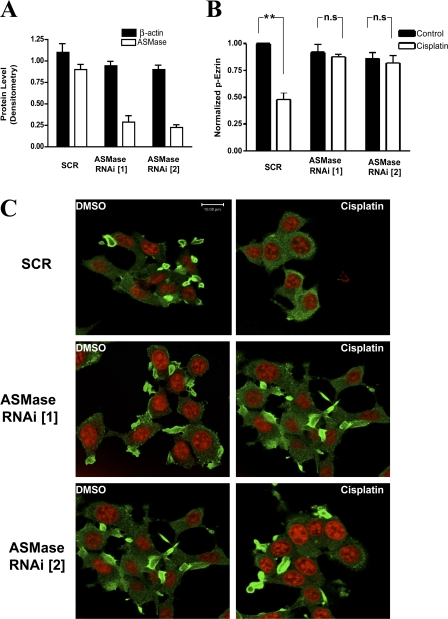
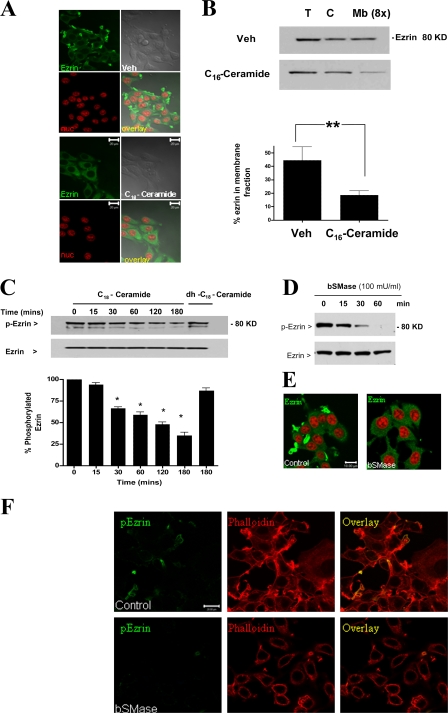
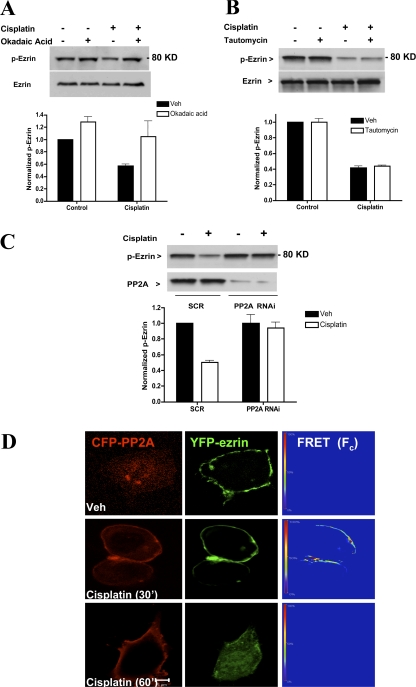
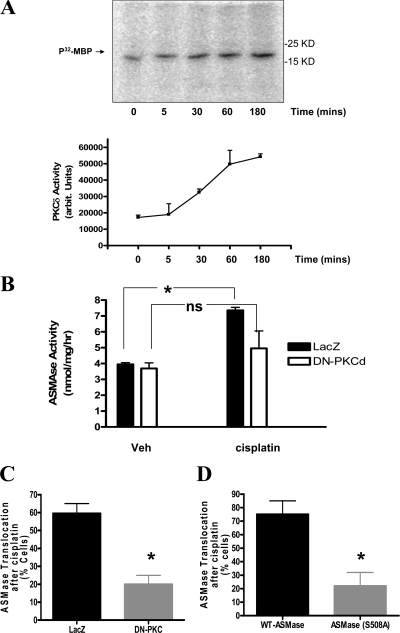
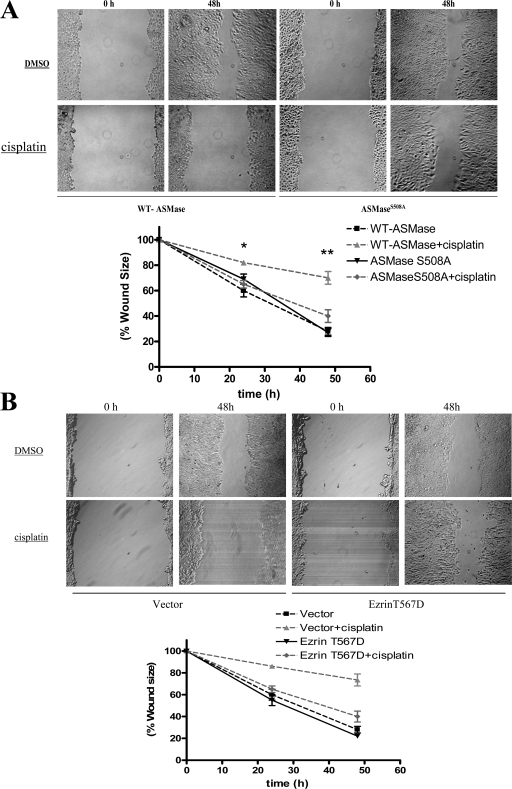
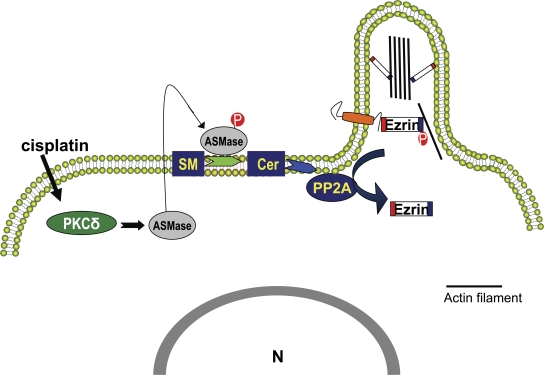
The chemotherapeutic agent cisplatin is widely used in treatment of solid tumors. In breast cancer cells, cisplatin produces early and marked changes in cell morphology and the actin cytoskeleton. These changes manifest as loss of lamellipodia/filopodia and appearance of membrane ruffles. Furthermore, cisplatin induces dephosphorylation of the actin-binding protein ezrin, and its relocation from membrane protrusions to the cytosol. Because cisplatin activates acid sphingomyelinase (ASMase), we investigate here the role of the ASMase/ceramide (Cer) pathway in mediating these morphological changes. We find that cisplatin induces a transient elevation in ASMase activity and its redistribution to the plasma membrane. This translocation is blocked upon overexpression of a dominant-negative (DN) ASMase(S508A) mutant and by a DN PKCdelta. Importantly; knockdown of ASMase protects MCF-7 cells from cisplatin-induced cytoskeletal changes including ezrin dephosphorylation. Reciprocally, exogenous delivery of D-e-C16-Cer, but not dihydro-C16-Cer, recapitulates the morphotropic effects of cisplatin. Collectively, these results highlight a novel tumor suppressor property for Cer and a function for ASMase in cisplatin-induced cytoskeletal remodeling.


Figures

Figure 1.
Figure 1.
Effects of cisplatin on MCF-7 cellular cytoskeleton. (A) MCF-7 cells were grown on 10-cm dishes up to 60% confluency. Then cells were treated with either cisplatin (5 μg/ml) or DMSO for 2 h. Cell morphology was examined under an inverted light microscope equipped with a CCD camera using 20x objectives. Representative areas are enlarged in the insets. (B) Cells treated as in A were fixed and stained with rhodamine-phalloidin. (C) Cells treated with vehicle (DMSO), phalloidin, cytochalasin D, or cisplatin (60 and 120 min) were analyzed for filamentous (F) and globular (G) actin by Western blotting. Results were quantitated by densitometry using NIH ImageJ. Figures are representative of at least three independent experiments.
Figure 2.
Figure 2.
Treatment with cisplatin causes relocation of ezrin. MCF-7 cells were treated with DMSO or cisplatin (5 μg/ml) for 2 h. (A) Cells were fixed and stained with ezrin-specific polyclonal antibody (green channel) before laser-scanning confocal microscopy. Nuclei were visualized using DRAQ5 nuclear dye (red channel). Shown are representative images of multiple experiments. Representative areas are enlarged in the insets. (B) Cells were homogenized and fractionated into cytosolic and membrane fractions by centrifugation at 100,000 g. Amount of ezrin in total, cytosolic, and membrane fractions (concentrated eightfold) was detected by Western blotting. (C) MCF-7 cells (5 x 10⁵ cells/10-cm plate) were treated with DMSO or cisplatin (5 μg/ml) for the indicated time points up to 2 h. Levels of p-ezrin and total ezrin were detected by specific rabbit polyclonal antibodies. (D) Cells treated with DMSO or cisplatin (5 μg/ml) for 2 h were stained for p-ezrin (green channel) and phalloidin (red channel). Blots from three independent experiments were quantitated using NIH ImageJ (*, P < 0.05). Images are representative of three independent experiments. Bars, 20 μm.
Figure 3.
Figure 3.
LC/MS analysis of cisplatin effects on ceramide and sphingomyelin. Cells were treated with cisplatin (5 μg/ml) for 15, 30, 60, or 180 min. After Bligh Dyer extraction of lipids, the different treatment groups were subjected to mass spectrometric analysis as indicated in Materials and methods. Sphingolipids measurements were normalized to total phospholipids. Shown are the normalized results for (A) total ceramide, (B) total SM, (C) C16 and C24:1-ceramide, and (D) C16 and C24:1-SM. Ceramide and SM results represent averages ± S.E. from three independent experiments.
Figure 4.
Figure 4.
Activation of ASMase after treatment with cisplatin. (A) MCF-7 cells were treated with either DMSO or cisplatin (5 μg/ml) for 15, 30, 60, or 180 min. Total lysates (100 μg/sample) were subjected to SMase assays (ASMase, NSMase; neutral sphingomyelinase and S-SMase; secretory sphingomyelinase) as described under Materials and methods. Results shown are averaged from three enzymatic assays ± S.E. (*, P < 0.05). (B and C) Cells plated on 2-cm confocal dishes (5 × 10⁵ cells/plate) were transfected with 1 μg of the V5-ASMase plasmid. After 24 h, cells were incubated with either DMSO or cisplatin (5 μg/ml) for 30 min. Localization of ASMase was detected using a V5 monoclonal antibody (green channel) in permeabilized (B) or non-permeabilized cells (C). Sphingomyelin was visualized indirectly using the SM-binding protein, lysenin (red channel). Immunofluorescence was performed using a polyclonal lysenin antibody. Nuclei (NUC) were labeled using DRAQ5 nuclear dye. Shown are representative images of three independent experiments. Bars, 5 μm.
Figure 5.
Figure 5.
ASMase is upstream of cisplatin-induced ezrin dephosphorylation. (A) MCF-7 cells were transfected with 10 nM of either SCR or ASMase RNAi oligonucleotides. After 48 h, levels of ASMase and β-actin were determined by Western blotting and quantitated by densitometry. (B) Cells were treated with either DMSO or cisplatin (5 μg/ml) for 60 min. Lysates (30 μg) from each treatment group were used to detect levels of phosphorylated ezrin (p-ezrin) and ezrin by Western blotting. Blots from three independent experiments were quantitated using NIH ImageJ (**, P < 0.01; n.s, non significant). (C) Cells plated on 2-cm confocal dishes were transfected with 20 nM of SCR or two ASMase RNAi oligonucleotides (ASMase RNAi [1] and [2]). After 48 h, cells were treated with either DMSO or cisplatin for 60 min. Then cells were fixed and stained using ezrin-specific polyclonal antibody. Images are representative of three independent experiments. Bars, 10 μm.
Figure 6.
Figure 6.
Exogenous ceramide mimics cytoskeletal effects of cisplatin. MCF-7 cells were treated with D-e-C16-ceramide (5 μM) or vehicle (2% dodecane/98% ethanol) for 2 h. (A) Cells were fixed and stained with ezrin-specific polyclonal antibody (green channel). Nuclei were visualized using DRAQ5 nuclear dye. (B) Cells were homogenized and fractionated into a cytosolic and membrane fractions by centrifugation at 100,000 g. Amount of ezrin in total, cytosolic, and membrane fractions (concentrated eightfold) was detected by Western blotting. (C) Cells were treated with D-e-C16-ceramide (5 μM), dh-C16-ceramide (5 μM), or vehicle (2% dodecane/98% ethanol) up to 3 h. Levels of p-ezrin and total ezrin were detected by Western blotting. (D) Cells treated with bSMase (100 mU/ml) for 0, 15, 30, and 60 min were subjected to Western blot analysis for ezrin and p-ezrin levels. (E) Subcellular distribution of ezrin in control cells and cells treated with bSMase (100 mU/ml) for 60 min. (F) Cells treated as in D were stained for p-ezrin (green channel) and phalloidin (red channel). Results are representative of three independent experiments. Blots from three independent experiments were quantitated using NIH ImageJ (*, P < 0.05). Bars, 20 μm.
Figure 7.
Figure 7.
PP2A mediates dephosphorylation of ezrin by cisplatin. Cells plated on 10-cm dishes (5 × 10⁵ cells/dish) were pretreated with 10 nM of either okadaic acid (A) or tautomycin (B). After 1 h, cells were incubated with DMSO or cisplatin (5 μg/ml) for 1 h. Phospho-ezrin levels were evaluated by Western blotting using a specific polyclonal antibody. (C) Cells were transfected with 20 nM of either SCR or PP2A (catalytic subunit) specific oligonucleotides. After 48 h, cells were subjected to DMSO or cisplatin treatments for 1 h. Lysates (30 μg) were analyzed by Western blotting for levels of p-ezrin and PP2A. Blots shown are representative of at least three independent experiments. Densitometric analysis was performed using NIH Image software. (D) MCF-7 cells expressing YFP-ezrin and CFP-PP2A (catalytic subunit) were subjected to sensitized emission FRET analysis. After 24 h of plasmid transfection, cells were treated with DMSO or cisplatin for 30 and 60 min. A representative FRET image of at least 30 cells imaged in three experiments is shown. FRET efficiencies are encoded by using the color bar scale shown on the left. Colors range between blue (lowest FRET) and red (highest FRET).
Figure 8.
Figure 8.
PKCδ is upstream of ASMase activation by cisplatin. (A) MCF-7 cells (5 × 10⁵ cells/plate) were treated with DMSO or cisplatin (5 μg/ml) for 5, 30, 60, or 180 min. PKCδ was immunoprecipitated from lysates of each treatment group and subjected to in vitro kinase assay as described in Materials and methods.32P-MBP was visualized by autoradiography. Average densitometric analysis + S.E. of three independent experiments are plotted. (B) Cells were infected with control LacZ or DN-PKCδ adenoviruses (multiplicity of infection of 50). After 24 h, cells were treated with DMSO or cisplatin for 30 min. Samples of total lysates (100 μg) were then subjected to in vitro ASMase assay. (C and D) Cells overexpressing ASMase (or ASMaseS508A) were infected with LacZ or DN-PKCδ adenoviruses as in B before treatment with either DMSO or cisplatin for 30 min. Localization of ASMase was observed by confocal microscopy using a V5 monoclonal antibody staining in permeabilized cells. Percentage of cells showing plasma membrane translocation of ASMase was quantitated from at least 10 random visual fields each containing 15–20 cells per field. (*, P < 0.05). ns, not significant.
Figure 9.
Figure 9.
Differential migratory response of WT-ASMase vs. ASMaseS508A cells to cisplatin treatment. MCF-7 cells stably overexpressing WT-ASMase or ASMaseS508A were treated with either cisplatin or DMSO. (A) Cell migration was analyzed by wound-healing assay as described under Materials and methods. Wound size was measured at 0, 24, and 48 h after scratching a confluent monolayer of cells. (B) Cells overexpressing ezrin T567D or a control (pCB6) plasmid were subjected to the wound-healing migration assay. Cell migration was assessed by measuring wound size at 0, 24, and 48 h. Results shown are representative of three independent experiments (*, P < 0.05).
Figure 10.
Figure 10.
Model of cisplatin-induced cytoskeletal remodeling. The model depicts activation of the ASMase/ceramide pathway by cisplatin as a key step upstream of actin rearrangement. The serine/threonine phosphatase PP2A links ceramide generation to ezrin dephosphorylation and cytosolic relocation. Inactivation of ezrin results in dissociation of actin filaments from the plasma membrane and resorption of cellular filopodia.

References

    1. Bezombes, C., G. Laurent, and J.P. Jaffrezou. 2003. Implication of raft microdomains in drug induced apoptosis. Curr. Med. Chem. Anti-cancer. Agents. 3:263–270. - PubMed
    1. Bielawski, J., Z.M. Szulc, Y.A. Hannun, and A. Bielawska. 2006. Simultaneous quantitative analysis of bioactive sphingolipids by high-performance liquid chromatography-tandem mass spectrometry. Methods. 39:8 - PubMed
    1. Bijman, M.N., G.P. van Nieuw Amerongen, N. Laurens, V.W. van Hinsbergh, and E. Boven. 2006. Microtubule-targeting agents inhibit angiogenesis at subtoxic concentrations, a process associated with inhibition of Rac1 and Cdc42 activity and changes in the endothelial cytoskeleton. Mol. Cancer Ther. 5:2348–2357. - PubMed
    1. Bretscher, A., K. Edwards, and R.G. Fehon. 2002. ERM proteins and merlin: integrators at the cell cortex. Nat. Rev. Mol. Cell Biol. 3:586–599. - PubMed
    1. Brown, M.J., R. Nijhara, J.A. Hallam, M. Gignac, K.M. Yamada, S.L. Erlandsen, J. Delon, M. Kruhlak, and S. Shaw. 2003. Chemokine stimulation of human peripheral blood T lymphocytes induces rapid dephosphorylation of ERM proteins, which facilitates loss of microvilli and polarization. Blood. 102:3890–3899. - PubMed

Publication types