

Structural insights for designed alanine-rich helices: comparing NMR helicity measures and conformational ensembles from molecular dynamics simulation
- PMID: 18428207
- PMCID: PMC3816200
- DOI: 10.1002/bip.21004
Structural insights for designed alanine-rich helices: comparing NMR helicity measures and conformational ensembles from molecular dynamics simulation
Abstract
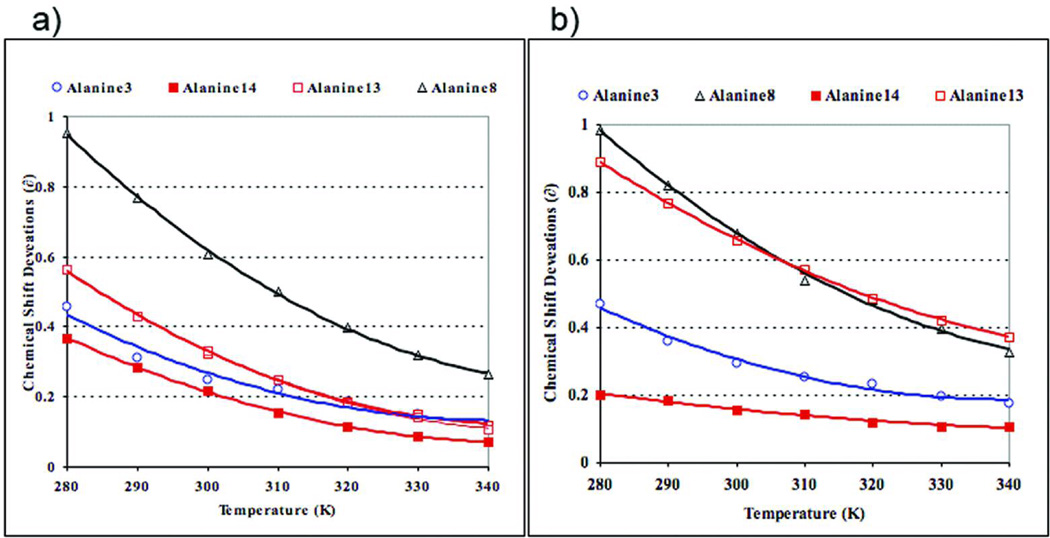
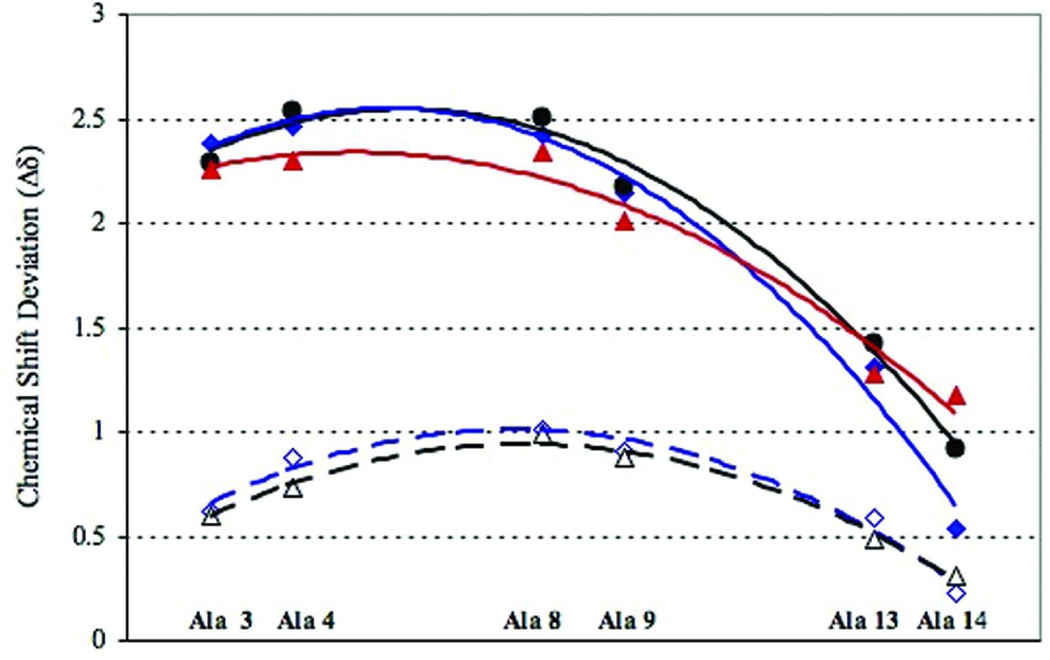
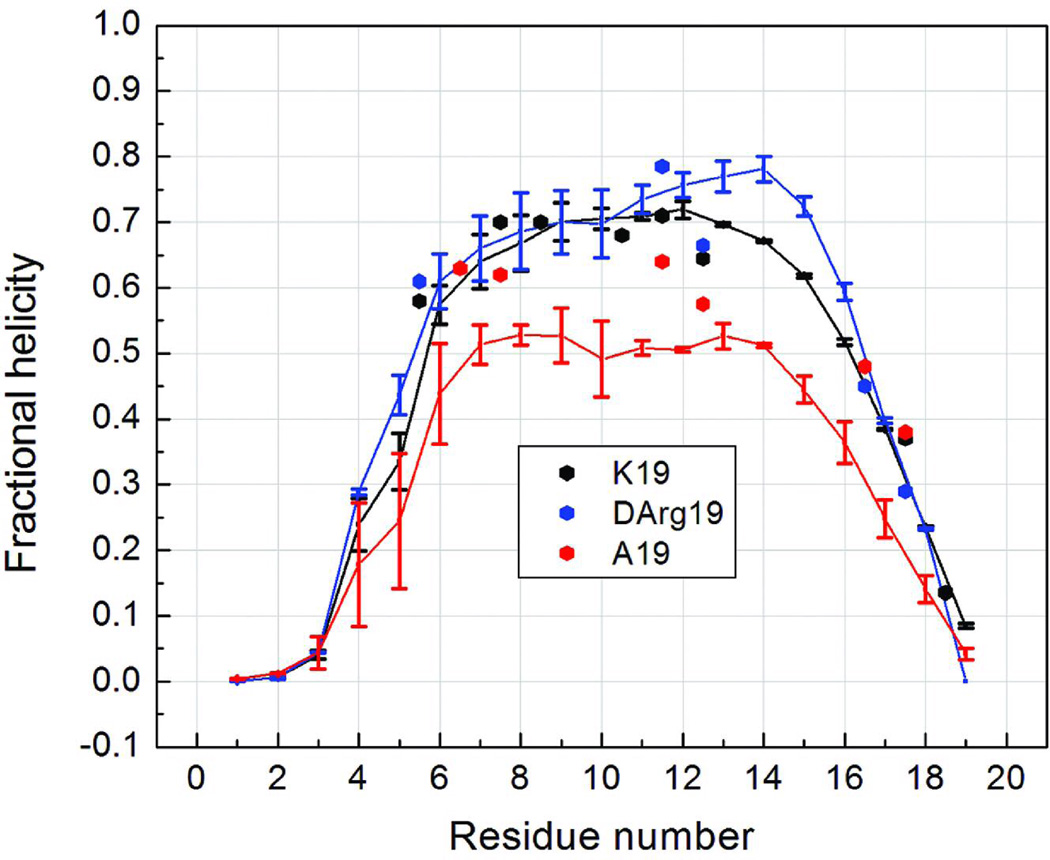
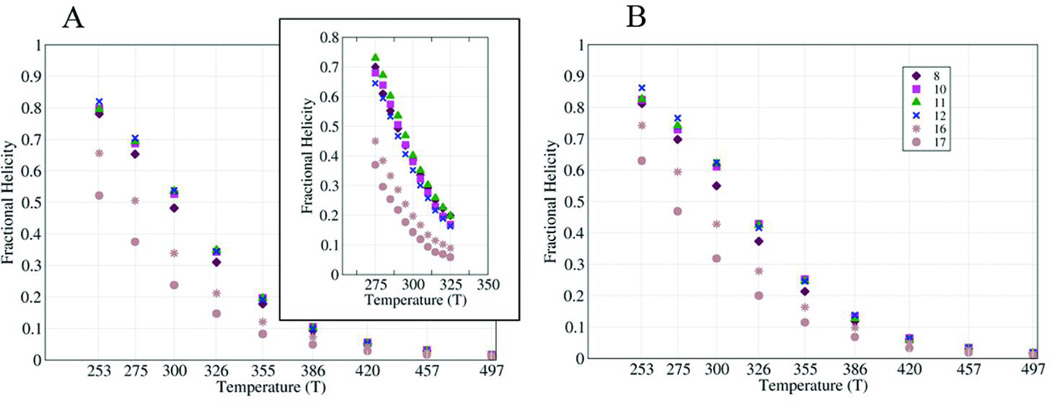
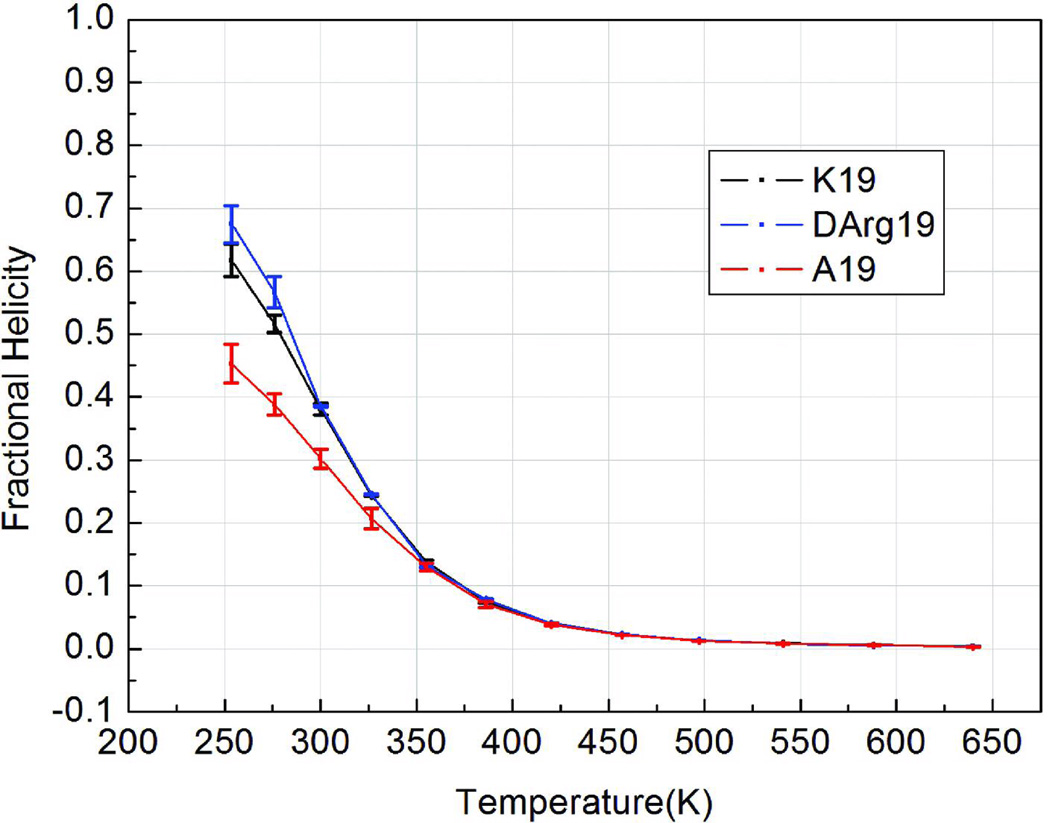
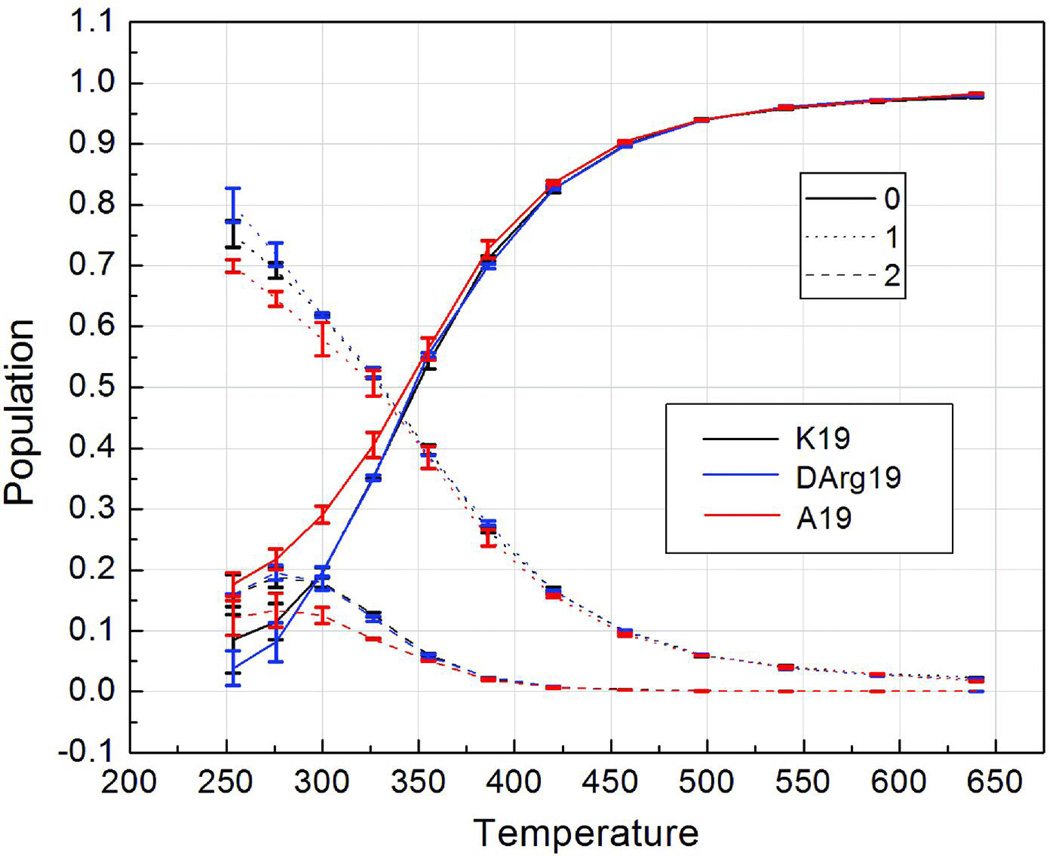
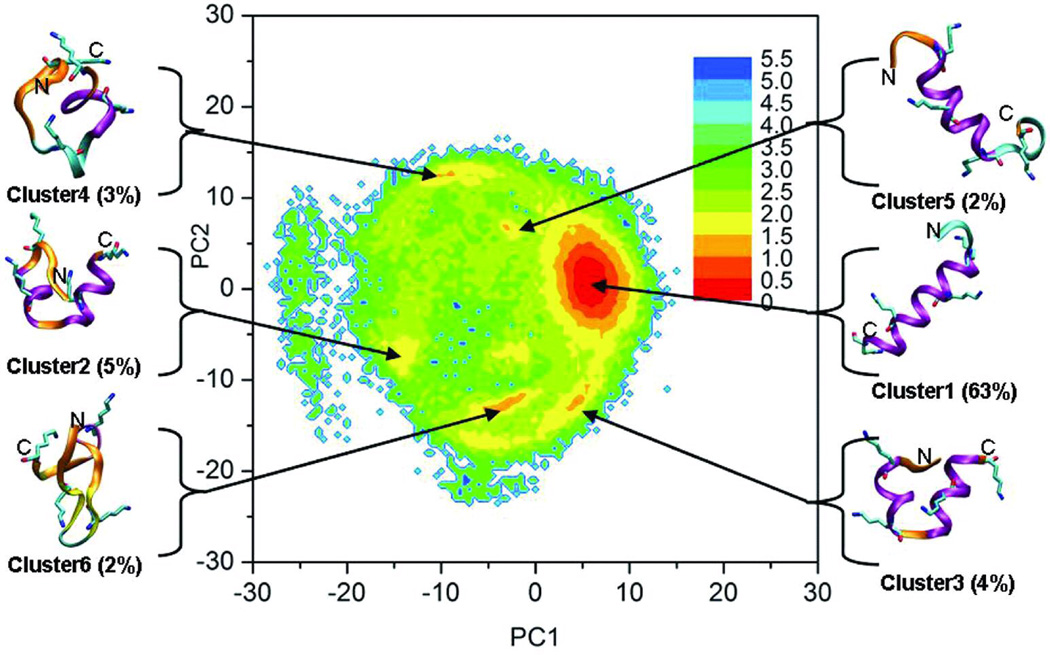
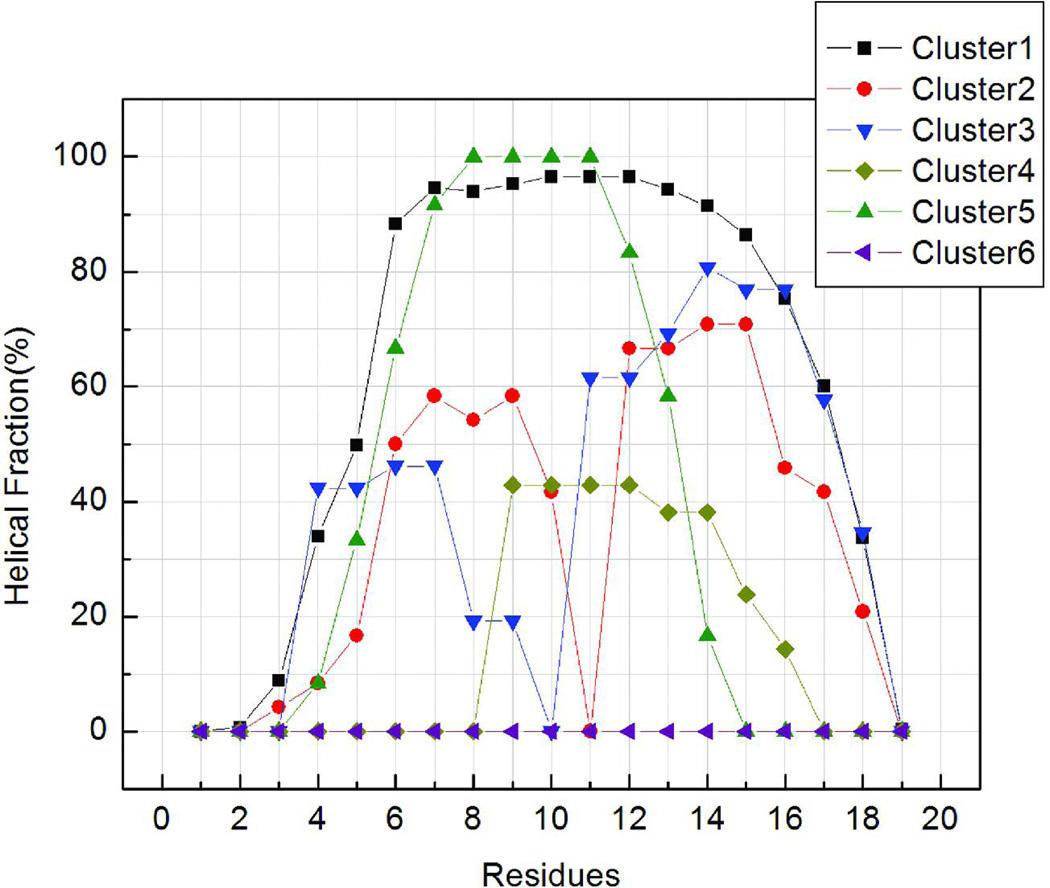
The temperature dependence of helical propensities for the peptides Ac-ZGG-(KAAAA)(3)X-NH(2) (Z = Y or G, X = A, K, and D-Arg) were studied both experimentally and by MD simulations. Good agreement is observed in both the absolute helical propensities as well as relative helical content along the sequence; the global minimum on the calculated free energy landscape corresponds to a single alpha-helical conformation running from K4 to A18 with some terminal fraying, particularly at the C-terminus. Energy component analysis shows that the single helix state has favorable intramolecular electrostatic energy due to hydrogen bonds, and that less-favorable two-helix globular states have favorable solvation energy. The central lysine residues do not appear to increase helicity; however, both experimental and simulation studies show increasing helicity in the series X = Ala --> Lys --> D-Arg. This C-capping preference was also experimentally confirmed in Ac-(KAAAA)(3)X-GY-NH(2) and (KAAAA)(3)X-GY-NH(2) sequences. The roles of the C-capping groups, and of lysines throughout the sequence, in the MD-derived ensembles are analyzed in detail.
Figures
Similar articles
-
The helical alanine controversy: an (Ala)6 insertion dramatically increases helicity.J Am Chem Soc. 2004 Oct 27;126(42):13679-84. doi: 10.1021/ja047265o. J Am Chem Soc. 2004. PMID: 15493925 Free PMC article.
-
Conformational preferences of a short Aib/Ala-based water-soluble peptide as a function of temperature.Proteins. 2009 Jul;76(1):184-200. doi: 10.1002/prot.22337. Proteins. 2009. PMID: 19137603
-
Role of hydrophobicity and solvent-mediated charge-charge interactions in stabilizing alpha-helices.Biophys J. 1998 Dec;75(6):2637-46. doi: 10.1016/S0006-3495(98)77709-4. Biophys J. 1998. PMID: 9826588 Free PMC article.
-
Mechanism for the noncovalent chiral domino effect: new paradigm for the chiral role of the N-terminal segment in a 3(10)-helix.J Am Chem Soc. 2003 Jul 9;125(27):8151-62. doi: 10.1021/ja035040s. J Am Chem Soc. 2003. PMID: 12837085
-
Thermodynamics and mechanism of alpha helix initiation in alanine and valine peptides.Biochemistry. 1991 Jun 18;30(24):6059-70. doi: 10.1021/bi00238a033. Biochemistry. 1991. PMID: 2043644
Cited by
-
Improved Generalized Born Solvent Model Parameters for Protein Simulations.J Chem Theory Comput. 2013 Apr 9;9(4):2020-2034. doi: 10.1021/ct3010485. J Chem Theory Comput. 2013. PMID: 25788871 Free PMC article.
-
Force Field Effects in Simulations of Flexible Peptides with Varying Polyproline II Propensity.J Chem Theory Comput. 2021 Oct 12;17(10):6634-6646. doi: 10.1021/acs.jctc.1c00408. Epub 2021 Sep 15. J Chem Theory Comput. 2021. PMID: 34524800 Free PMC article.
-
Lysine and arginine residues do not increase the helicity of alanine-rich peptide helices.Chem Commun (Camb). 2008 Oct 21;(39):4765-7. doi: 10.1039/b807101b. Epub 2008 Aug 8. Chem Commun (Camb). 2008. PMID: 18830486 Free PMC article.
-
Force field development phase II: Relaxation of physics-based criteria… or inclusion of more rigorous physics into the representation of molecular energetics.J Comput Aided Mol Des. 2019 Feb;33(2):205-264. doi: 10.1007/s10822-018-0134-x. Epub 2018 Nov 30. J Comput Aided Mol Des. 2019. PMID: 30506159 Review.
-
Partial unfolding and refolding for structure refinement: A unified approach of geometric simulations and molecular dynamics.Proteins. 2015 Dec;83(12):2279-92. doi: 10.1002/prot.24947. Epub 2015 Nov 17. Proteins. 2015. PMID: 26476100 Free PMC article.
References
Publication types
MeSH terms
Substances
Grants and funding
LinkOut - more resources
Full Text Sources
