. 2006 Oct:Chapter 5:Unit-5.6.
doi: 10.1002/0471250953.bi0506s15.

Comparative protein structure modeling using Modeller

Affiliations

Comparative protein structure modeling using Modeller

Narayanan Eswar et al. Curr Protoc Bioinformatics. 2006 Oct.

Abstract

Functional characterization of a protein sequence is one of the most frequent problems in biology. This task is usually facilitated by accurate three-dimensional (3-D) structure of the studied protein. In the absence of an experimentally determined structure, comparative or homology modeling can sometimes provide a useful 3-D model for a protein that is related to at least one known protein structure. Comparative modeling predicts the 3-D structure of a given protein sequence (target) based primarily on its alignment to one or more proteins of known structure (templates). The prediction process consists of fold assignment, target-template alignment, model building, and model evaluation. This unit describes how to calculate comparative models using the program MODELLER and discusses all four steps of comparative modeling, frequently observed errors, and some applications. Modeling lactate dehydrogenase from Trichomonas vaginalis (TvLDH) is described as an example. The download and installation of the MODELLER software is also described.


Figures
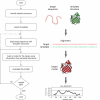
Figure 5.6.1
Figure 5.6.1
Steps in comparative protein structure modeling. See text for details.
Figure 5.6.2
Figure 5.6.2
File TvLDH.ali. Sequence file in PIR format.
Figure 5.6.3
Figure 5.6.3
File build_profile.py. Input script file that searches for templates against a database of nonredundant PDB sequences.
Figure 5.6.4
Figure 5.6.4
An excerpt from the file build_profile.prf. The aligned sequences have been removed for convenience.
Figure 5.6.5
Figure 5.6.5
Script file compare.py.
Figure 5.6.6
Figure 5.6.6
Excerpts from the log file compare.log.
Figure 5.6.7
Figure 5.6.7
The script file align2d.py, used to align the target sequence against the template structure.
Figure 5.6.8
Figure 5.6.8
The alignment between sequences TvLDH and 1bdmA, in the MODELLER PAP format. File TvLDH-1bmdA.pap.
Figure 5.6.9
Figure 5.6.9
Script file, model-single.py, that generates five models.
Figure 5.6.10
Figure 5.6.10
File evaluate_model.py, used to generate a pseudo-energy profile for the model.
Figure 5.6.11
Figure 5.6.11
A comparison of the pseudo-energy profiles of the model (red) and the template (green) structures.
Figure 5.6.12
Figure 5.6.12
Typical errors in comparative modeling. (A) Errors in side chain packing. The Trp 109 residue in the crystal structure of mouse cellular retinoic acid binding protein I (red) is compared with its model (green). (B) Distortions and shifts in correctly aligned regions. A region in the crystal structure of mouse cellular retinoic acid binding protein I (red) is compared with its model (green) and with the template fatty acid binding protein (blue). (C) Errors in regions without a template. The Cα trace of the 112–117 loop is shown for the X-ray structure of human eosinophil neurotoxin (red), its model (green), and the template ribonuclease A structure (residues 111–117; blue). (D) Errors due to misalignments. The N-terminal region in the crystal structure of human eosinophil neurotoxin (red) is compared with its model (green). The corresponding region of the alignment with the template ribonuclease A is shown. The red lines show correct equivalences, that is, residues whose Cα atoms are within 5 Å of each other in the optimal least-squares superposition of the two X-ray structures. The “a” characters in the bottom line indicate helical residues and “b” characters, the residues in sheets. (E) Errors due to an incorrect template. The X-ray structure of α-trichosanthin (red) is compared with its model (green) that was calculated using indole-3-glycerophosphate synthase as the template.
Figure 5.6.13
Figure 5.6.13
Accuracy and application of protein structure models. The vertical axis indicates the different ranges of applicability of comparative protein structure modeling, the corresponding accuracy of protein structure models, and their sample applications. (A) The docosahexaenoic fatty acid ligand (violet) was docked into a high accuracy comparative model of brain lipid-binding protein (right), modeled based on its 62% sequence identity to the crystallographic structure of adipocyte lipid-binding protein (PDB code 1adl). A number of fatty acids were ranked for their affinity to brain lipid-binding protein consistently with site-directed mutagenesis and affinity chromatography experiments (Xu et al., 1996), even though the ligand specificity profile of this protein is different from that of the template structure. Typical overall accuracy of a comparative model in this range of sequence similarity is indicated by a comparison of a model for adipocyte fatty acid binding protein with its actual structure (left). (B) A putative proteoglycan binding patch was identified on a medium-accuracy comparative model of mouse mast cell protease 7 (right), modeled based on its 39% sequence identity to the crystallographic structure of bovine pancreatic trypsin (2ptn) that does not bind proteoglycans. The prediction was confirmed by site-directed mutagenesis and heparin-affinity chromatography experiments (Matsumoto et al., 1995). Typical accuracy of a comparative model in this range of sequence similarity is indicated by a comparison of a trypsin model with the actual structure. (C) A molecular model of the whole yeast ribosome (right) was calculated by fitting atomic rRNA and protein models into the electron density of the 80S ribosomal particle, obtained by electron microscopy at 15 Å resolution (Spahn et al., 2001). Most of the models for 40 out of the 75 ribosomal proteins were based on template structures that were approximately 30% sequentially identical. Typical accuracy of a comparative model in this range of sequence similarity is indicated by a comparison of a model for a domain in L2 protein from B. stearothermophilus with the actual structure (1rl2).

References

    1. Abagyan R, Totrov M. Biased probability Monte Carlo conformational searches and electrostatic calculations for peptides and proteins. J. Mol. Biol. 1994;235:983–1002. - PubMed
    1. Altschul SF, Madden TL, Schaffer AA, Zhang J, Zhang Z, Miller W, Lipman DJ. Gapped BLAST and PSI-BLAST: a new generation of protein database search programs. Nucleic Acids Res. 1997;25:3389–3402. - PMC - PubMed
    1. Andreeva A, Howorth D, Brenner SE, Hubbard TJ, Chothia C, Murzin AG. SCOP database in 2004: refinements integrate structure and sequence family data. Nucleic Acids Res. 2004;32:D226–229. - PMC - PubMed
    1. Armougom F, Moretti S, Poirot O, Audic S, Dumas P, Schaeli B, Keduas V, Notredame C. Expresso: automatic incorporation of structural information in multiple sequence alignments using 3D-Coffee. Nucleic Acids Res. 2006;34:W604–608. - PMC - PubMed
    1. Arnold K, Bordoli L, Kopp J, Schwede T. The SWISS-MODEL workspace: a web-based environment for protein structure homology modelling. Bioinformatics. 2006;22:195–201. - PubMed

Publication types

LinkOut - more resources