. 2007 Sep:Chapter 10:Unit 10.5.
doi: 10.1002/0471250953.bi1005s19.

Using galaxy to perform large-scale interactive data analyses

Affiliations

Using galaxy to perform large-scale interactive data analyses

James Taylor et al. Curr Protoc Bioinformatics. 2007 Sep.

Abstract

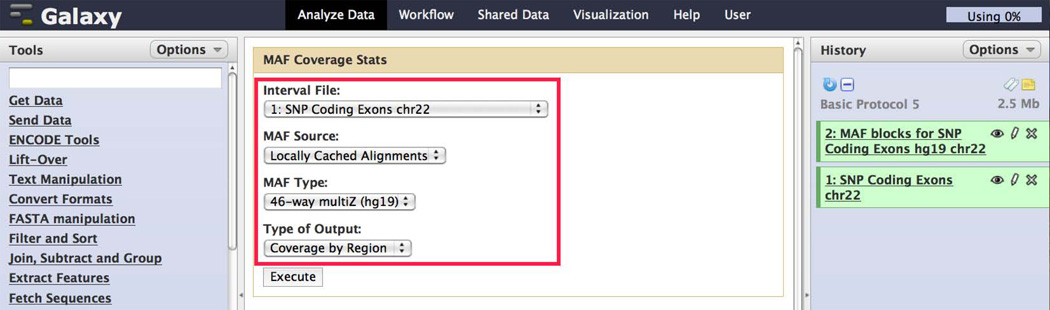
While most experimental biologists know where to download genomic data, few have a concrete plan on how to analyze it. This situation can be corrected by: (1) providing unified portals serving genomic data and (2) building Web applications to allow flexible retrieval and on-the-fly analyses of the data. Powerful resources, such as the UCSC Genome Browser already address the first issue. The second issue, however, remains open. For example, how to find human protein-coding exons with the highest density of single nucleotide polymorphisms (SNPs) and extract orthologous sequences from all sequenced mammals? Indeed, one can access all relevant data from the UCSC Genome Browser. But once the data is downloaded how would one deal with millions of SNPs and gigabytes of alignments? Galaxy (http://g2.bx.psu.edu) is designed specifically for that purpose. It amplifies the strengths of existing resources (such as UCSC Genome Browser) by allowing the user to access and, most importantly, analyze data within a single interface in an unprecedented number of ways.


Figures

Figure 10.5.1
Figure 10.5.1
Galaxy interface contains four areas: the top bar, Tools panel (left column), detail panel (middle column), and History panel (right column). The top bar contains user account controls as well as help and contact links. The left panel lists the analysis tools and data sources available to the user. The middle panel displays interfaces for tools selected by the user. The right panel (the History panel) shows datasets and the results of analyses performed by the user. Pictured here are four history items in two different stages of completion: The two “FASTQ Groomer” items are yellow, meaning they are in progress, while the two “ungroomed” items are shown in green, meaning they have completed successfully. Every action by the user generates one or more new history items, which can then be used in subsequent analyses, downloaded, or visualized.
Figure 10.5.2
Figure 10.5.2
Uploading a list of protein-coding exons (in BED format) of known human genes from the UCSC Table browser involves two steps (A and B) described in the text.
Figure 10.5.2
Figure 10.5.2
Uploading a list of protein-coding exons (in BED format) of known human genes from the UCSC Table browser involves two steps (A and B) described in the text.
Figure 10.5.3
Figure 10.5.3
When a job is queued, a history item is initially gray. When a job is running, a history item is yellow. When a job is complete, a history item is green (successful) or red (error).
Figure 10.5.4
Figure 10.5.4
Close up of Galaxy history item. Clicking on links and icons trigger the following events: eye = shows first megabyte of dataset in Galaxy’s middle panel; pencil = open metadata editor. This brings up interface in the middle panel of the Galaxy screen that allows one to edit the attributes of the current history item. For example, one may wish to give the history item a more descriptive name or change column assignments (see Basic Protocol 2); × = delete item from the history (To undelete or permanently delete, use the history’s Options menu and select “View deleted datasets”.); “save” = copy dataset to your computer; “i” = view details about this dataset in center panel, including the dataset(s), if any it was generated from. “rerun” = display this tool in center panel with the same settings it was run with, allowing this step to be exactly rerun or to be modified and rerun. “tags” = add free text tags to this dataset. “sticky note” = add free text annotation. Finally, if the dataset can be visualized in a browser, links to the Galaxy Track Browser (stacked bars icon) and to UCSC, GeneTrack, Ensembl, and others will also be displayed.
Figure 10.5.5
Figure 10.5.5
The “Edit Attributes” form in the center panel. Each attribute can be modified and saved. In this figure the system generated name has been copied to the “Info” field, and a short descriptive name entered in the “Name” field.
Figure 10.5.6
Figure 10.5.6
Data manipulation tools: Join (A), Count (B), Sort (C), Select first lines (D), and Compare two datasets (E).
Figure 10.5.7
Figure 10.5.7
Result of joining two interval datasets, highlighting a single exon that contains (overlaps with) 4 SNPs.
Figure 10.5.8
Figure 10.5.8
The data library “ChIP-Seq Mouse Example” is imported from a library into a history.
Figure 10.5.9
Figure 10.5.9
Filezilla (filezilla-project.org) is one example of a desktop FTP client that works well with Galaxy.
Figure 10.5.10
Figure 10.5.10
Get Data: Upload File tool. After a file has been uploaded using FTP, it appears in the “Files uploaded via FTP” section.
Figure 10.5.11
Figure 10.5.11
The Cut tool form and parameter options to select a single column (number 2, or “c2”) from a tab-delimited dataset.
Figure 10.5.12
Figure 10.5.12
Edit Attributes form in center panel, showing default metadata attributes assigned for the Interval format dataset.
Figure 10.5.13
Figure 10.5.13
Diagram of the columns “Cut” from the Interval formatted dataset to create a BED formatted dataset. The result “BED6” format contains the six fields: chromosome, start (0-based), end, name, score, and strand.
Figure 10.5.14
Figure 10.5.14
The Copy History form. The “Source History” on the left side of the center panel is the prior history from Basic Protocol 2. The “Destination History” on the right side of the center panel in the new history for Basic Protocol 3.
Figure 10.5.15
Figure 10.5.15
The FASTQ Groomer tool form in the center panel with input-data specific quality score type option selected.
Figure 10.5.16
Figure 10.5.16
The Bowtie tool form in the center panel with appropriate options selected. The highlighted parameters are those that are configured differently than the tool’s default options.
Figure 10.5.17
Figure 10.5.17
View of MACS tool form in the center panel with the appropriate options selected. The highlighted parameters are those that are configured differently than the tool’s default options.
Figure 10.5.18
Figure 10.5.18
History result datasets and HTML report detail produced by the MACS run.
Figure 10.5.19
Figure 10.5.19
Graphical explanation showing input and output datasets for several interval operations, including (A) Overlapping intervals, (B) Overlapping pieces of intervals, (C) Intervals with no overlap, (D) Non-overlapping pieces of intervals, (E) Concatenated intervals, (F) Merge,
Figure 10.5.19
Figure 10.5.19
Graphical explanation showing input and output datasets for several interval operations, including (A) Overlapping intervals, (B) Overlapping pieces of intervals, (C) Intervals with no overlap, (D) Non-overlapping pieces of intervals, (E) Concatenated intervals, (F) Merge,
Figure 10.5.20
Figure 10.5.20
Examples highlighting the functionality of coverage tools.
Figure 10.5.21
Figure 10.5.21
Graphical explanation of the (A) Complement, (B) Find clusters, and (C) Merge clusters interval tools.
Figure 10.5.21
Figure 10.5.21
Graphical explanation of the (A) Complement, (B) Find clusters, and (C) Merge clusters interval tools.
Figure 10.5.21
Figure 10.5.21
Graphical explanation of the (A) Complement, (B) Find clusters, and (C) Merge clusters interval tools.
Figure 10.5.22
Figure 10.5.22
Graphical explanation of genomic interval “Join” operations in Galaxy. (A) Only records that are joined, (B) All records of the first dataset, (C) Only records of second dataset, and (D) All records of both datasets. (E) Shows how all 4 variations are implemented on two small datasets.
Figure 10.5.22
Figure 10.5.22
Graphical explanation of genomic interval “Join” operations in Galaxy. (A) Only records that are joined, (B) All records of the first dataset, (C) Only records of second dataset, and (D) All records of both datasets. (E) Shows how all 4 variations are implemented on two small datasets.
Figure 10.5.23
Figure 10.5.23
Extract MAF blocks tool form highlighting a subset of the tool options.
Figure 10.5.25
Figure 10.5.25
Result file produced by the Extract MAF blocks tool. Data are the MAF alignment blocks corresponding to the query interval ranges.
Figure 10.5.25
Figure 10.5.25
MAF Coverage Stats tool form highlighting the tool options.
Figure 10.5.26
Figure 10.5.26
Result file produced by the MAF Coverage Stats tool using the option “Coverage by Region”. Data are counts for covered and not covered query bases that represent predicted evidence of conservation between the two species.
Figure 10.5.27
Figure 10.5.27
Result file produced by the MAF Coverage Stats tool using the option “Summarize Coverage”. Data has three columns: species, nucleotides, and coverage, where coverage is defined number of nucleotides divided by the total length of the provided intervals.
Figure 10.5.28
Figure 10.5.28
Result file produced by the Fetch Alignments: Stitch Gene blocks tool. Gapped bases are represented by the symbol “-”. It is expected that some MAF blocks will contain results with sequence, sequence plus gaps, or gaps only. Large gaps in the query or target genome may be interpreted as a region that is not well conserved. Input type should be carefully evaluated when choosing a MAF (or any) tool. The complete absence of sequence in the input query (as in the case of a non-coding RefSeq Gene, represented in the second block of this example) produces no results (sequence or gaps) in the output. As the Stitch Gene blocks tool is specifically designed to extract and stitch coding regions from the query input BED file, this is the correct result. To perform a similar function as Stitch Gene block for non-coding genes, the tool Stitch MAF blocks would be a better choice.
Figure 10.5.29
Figure 10.5.29
Shared Data: Published Workflows on the Main Galaxy instance at usegalaxy.org with the features for an individual workflow highlighted: Name (of workflow), Annotation (free text), Owner (Galaxy user name), Community Rating, Community tags (searchable keywords), Last Updated.
Figure 10.5.30
Figure 10.5.30
Detailed view of an individual workflow’s steps with the “Import workflow” link highlighted.
Figure 10.5.31
Figure 10.5.31
Your workflows page listing the newly imported workflow with the action menu highlighted. Menu selections: Edit, Run, Share or Publish, Download or Export, Clone, Rename, and Delete.
Figure 10.5.32
Figure 10.5.32
A workflow that is selected to “Run” is displayed as a form in the center panel. User-specified input selections from the current history are made by using a step’s pull-down menu, as highlighted.
Figure 10.5.33
Figure 10.5.33
Confirmation display when a workflow is executed (started) successfully. As the workflow is run, individual datasets produced by the workflow steps/jobs will be independently colored as gray (waiting to run), yellow (running), green (successful), and red (error). Note that all steps in the workflow are listed, including steps that produce hidden datasets.
Figure 10.5.34
Figure 10.5.34
Tools can sometimes produce datasets that no longer should be assigned to the current (or any single) reference genome. Use the Edit Attributes form to assign/reassign a new reference genome (see Figure 10.5.37) or to unassign a reference genome (as shown) by selecting the menu title (interpreted as a “null” database) from the list.
Figure 10.5.35
Figure 10.5.35
Filter tool form showing options, with the filter expression box highlighted containing a free text string. This specific filter string is designed to remove species rows that have no conserved genome sequence in the output of the Fetch Alignments: Stitch Gene blocks tool.
Figure 10.5.36
Figure 10.5.36
Select tool form showing options, with the select expression box highlighted containing a free text string. This specific select string is designed to extract lines from a file that start with “rheMac.”.
Figure 10.5.37
Figure 10.5.37
Tools can sometimes produce datasets that no longer should be assigned to the current (or any single) reference genome. Use the Edit Attributes form to assign/reassign a reference genome (as shown, in this case rheMac2) or to unassign a reference genome (see Figure 10.5.34).

References

    1. Birney E, Andrews D, Bevan P, Caccamo M, Cameron G, Chen Y, Clarke L, Coates G, Cox T, Cuff J, Curwen V, Cutts T, Down T, Durbin R, Eyras E, Fernandez-Suarez XM, Gane P, Gibbins B, Gilbert J, Hammond M, Hotz H, Iyer V, Kahari A, Jekosch K, Kasprzyk A, Keefe D, Keenan S, Lehvaslaiho H, McVicker G, Melsopp C, Meidl P, Mongin E, Pettett R, Potter S, Proctor G, Rae M, Searle S, Slater G, Smedley D, Smith J, Spooner W, Stabenau A, Stalker J, Storey R, Ureta-Vidal A, Woodwark C, Clamp M, Hubbard T. Ensembl 2004. Nucl. Acids Res. 2004;32:D468–D470. - PMC - PubMed
    1. Blankenberg D, Taylor J, Schenck I, He J, Zhang Y, Ghent M, Veeraraghavan N, Albert I, Miller W, Makova KD, Hardison RC, Nekrutenko A. A frame-work collaborative analysis of ENCODE data: Making large-scale analyses biologist-friendly. Genome Res. 2007;17:960–964. - PMC - PubMed
    1. Blankenberg D, Taylor J, Nekrutenko A Galaxy Team. Making whole genome multiple alignments usable for biologists. Bioinformatics. 2011 Sep 1;27(17):2426–2428. 2011. - PMC - PubMed
    1. Blankenberg D, Gordon A, Von Kuster G, Coraor N, Taylor J, Nekrutenko A Galaxy Team. Manipulation of FASTQ data with Galaxy. Bioinformatics. 2010 Jul 15;26(14):1783–1785. - PMC - PubMed
    1. Blankenberg D, Von Kuster G, Coraor N, Ananda G, Lazarus R, Mangan M, Nekrutenko A, Taylor J. Galaxy: a web-based genome analysis tool for experimentalists. Chapter 19:Unit 19.10.1-21. Current Protocols in Molecular Biology. 2010 Jan - PMC - PubMed

Publication types

LinkOut - more resources