. 2008 May;59(5):1021-9.
doi: 10.1002/mrm.21524.

Resting-state functional connectivity of the rat brain

Affiliations

Resting-state functional connectivity of the rat brain

Christopher P Pawela et al. Magn Reson Med. 2008 May.

Abstract

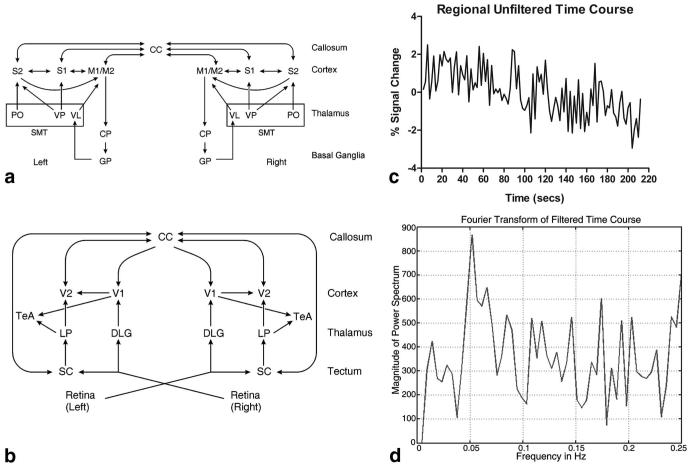
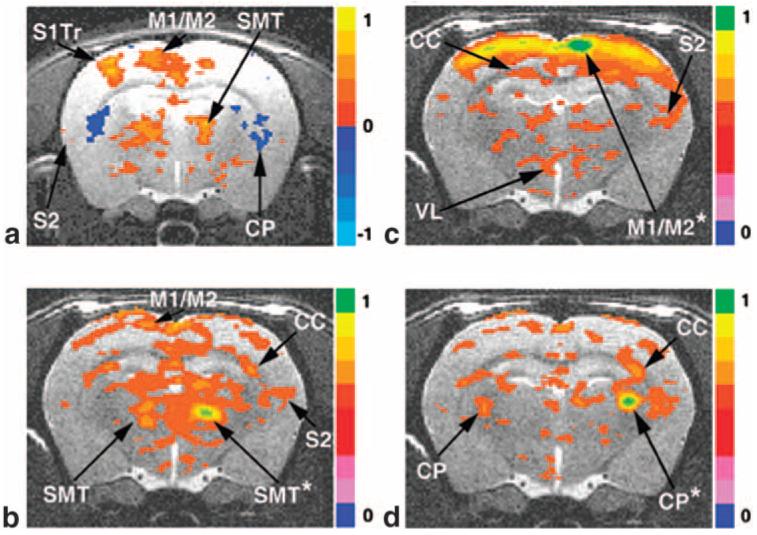
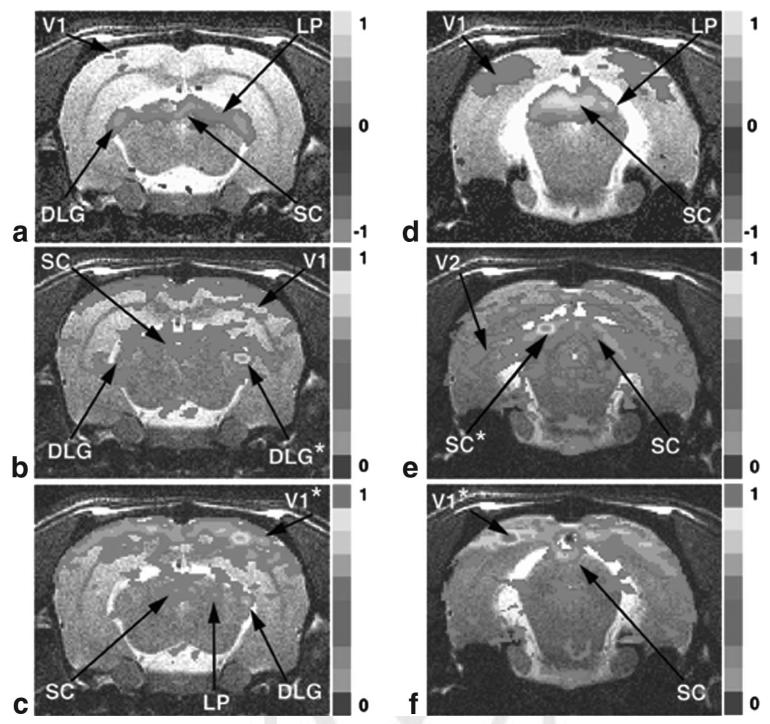
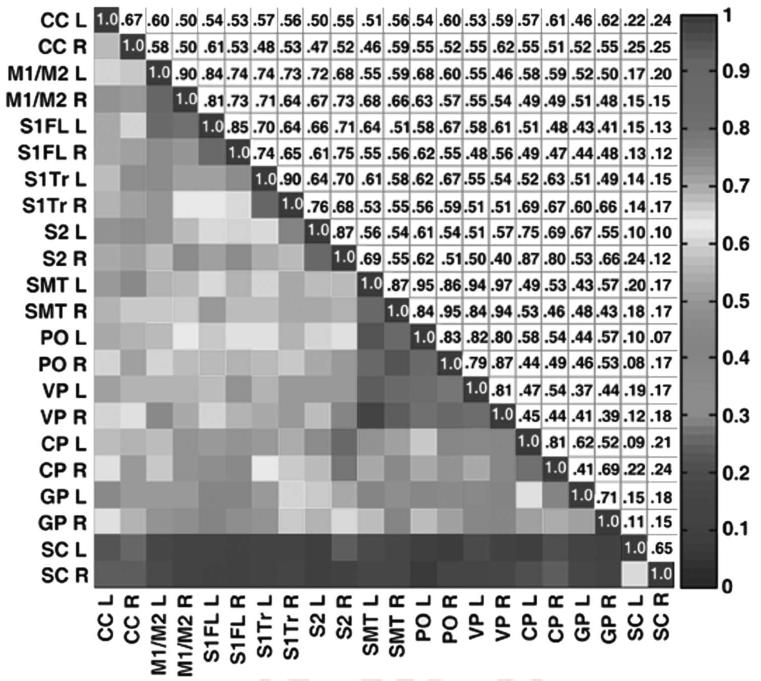
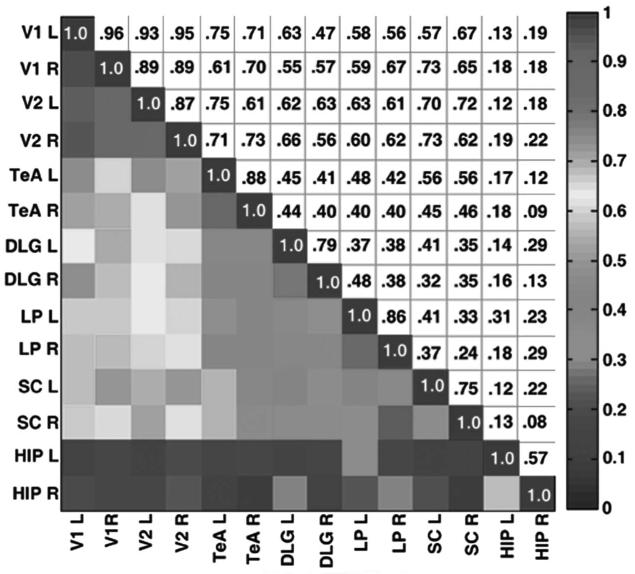
Regional-specific average time courses of spontaneous fluctuations in blood oxygen level dependent (BOLD) MRI contrast at 9.4T in lightly anesthetized resting rat brain are formed, and correlation coefficients between time course pairs are interpreted as measures of connectivity. A hierarchy of regional pairwise correlation coefficients (RPCCs) is observed, with the highest values found in the thalamus and cortex, both intra- and interhemisphere, and lower values between the cortex and thalamus. Independent sensory networks are distinguished by two methods: data driven, where task activation defines regions of interest (ROI), and hypothesis driven, where regions are defined by the rat histological atlas. Success in these studies is attributed in part to the use of medetomidine hydrochloride (Domitor) for anesthesia. Consistent results in two different rat-brain systems, the sensorimotor and visual, strongly support the hypothesis that resting-state BOLD fluctuations are conserved across mammalian species and can be used to map brain systems.


Figures

FIG. 1
FIG. 1
Simplified connection flowcharts of the rodent brain determined by prior work. a: Rodent motor/sensory system. b: Rodent visual system. System hierarchy moves from top to bottom. Arrows indicate primary information flow in the low to high hierarchy, although reciprocal connections are usually present. c: Percent BOLD signal change of a six-voxel reference region in the thalamus during a resting-state acquisition. This is indicative of a standard resting-state experiment. d: Filtered time course from (c) using a 0.1 Hz low-pass filter. Waveforms such as this are used in the analysis. See text for abbreviations.
FIG. 2
FIG. 2
fMRI BOLD activation and resting-state connectivity maps of the rodent sensorimotor system. a: Direct radial nerve stimulation of the right upper forelimb; -2.90 mm from bregma. b: Reference voxels placed in the right SMT. c: Reference region in right M1/M2. d: Reference region placed in the right CP. (a) is an activation map with a voxel threshold at P = 0.005; (b), (c), and (d) are resting-state maps (0.35 threshold) from representative reference regions marked by asterisks. Results from 15 rats are averaged. See text for abbreviations.
FIG. 3
FIG. 3
fMRI BOLD activation and resting-state connectivity maps of the rodent visual system. a: Bilateral blue LED flashing directly in the rodent eye; -5.40 mm from bregma. b: Reference voxels located in the right DLG. c: Reference voxels located in right V1. d: Bilateral blue LED activation; -7.32 mm from bregma. e: Reference voxels located in the left SC. f: Reference voxels in left V1. (a) and (d) are activation maps with a voxel threshold at P = 0.005. (b), (c), (e), and (f) are resting-state maps (0.35 threshold) from representative reference regions marked by asterisks. Results from 15 rats are averaged. See text for abbreviations. [Color figure can be viewed in the online issue, which is available at http://www.interscience.wiley.com.]
FIG. 4
FIG. 4
RPCC matrix of average resting-state BOLD time courses in the rat motor/sensory system. An average across 15 rats was used. Both the left and right side of each region were tabulated. The SC from the visual system was included as a control. The lower triangular part of the graph displays the coefficient values according to the color bar on the far right, and the upper triangular part (mirror image) of the graph tabulates the corresponding correlation coefficient values. Note the strongest correlations are intracortical and intrathalamic and the lowest correlations are in the control. See text for abbreviations. [Color figure can be viewed in the online issue, which is available at http://www.interscience.wiley.com.]
FIG. 5
FIG. 5
RPCC matrix of average resting-state time courses in the rat visual system. The average of 15 rats is used. The left and right sides of each region were tabulated. The lower triangular part of the graph displays the correlation coefficient values according to the color bar on the far right, and the mirror image lists the corresponding numerical values. Note the strongest correlations are within V1 and V2 and there is no correlation to the HIP control. See text for abbreviations. [Color figure can be viewed in the online issue, which is available at http://www.interscience.wiley.com.]

References

    1. Biswal B, Yetkin FZ, Haughton VM, Hyde JS. Functional connectivity in the motor cortex of resting human brain using echo-planar MRI. Magn Reson Med. 1995;34:537–541. - PubMed
    1. Cho YR, Pawela CP, Li R, Kao D, Schulte ML, Runquist ML, Yan J-G, Matloub HS, Jaradeh SS, Hudetz AG, Hyde JS. Refining the sensory and motor ratunculus of the rat upper extremity using fMRI and direct nerve stimulation. Magn Reson Med. 2007;58:901–909. - PMC - PubMed
    1. Paxinos G WC. The rat brain in stereotaxic coordinates. Elsevier Academic Press; New York: 2005.
    1. Biswal BB, Van Kylen J, Hyde JS. Simultaneous assessment of flow and BOLD signals in resting-state functional connectivity maps. NMR Biomed. 1997;10:165–170. - PubMed
    1. Lowe MJ, Mock BJ, Sorenson JA. Functional connectivity in single and multislice echoplanar imaging using resting-state fluctuations. Neuroimage. 1998;7:119–132. - PubMed

Publication types