Review
. 2004 May;Chapter 17(1):Unit 17.1.
doi: 10.1002/0471140864.ps1701s35.

Overview of protein structural and functional folds

Affiliations
Review

Overview of protein structural and functional folds

Peter D Sun et al. Curr Protoc Protein Sci. 2004 May.

Abstract

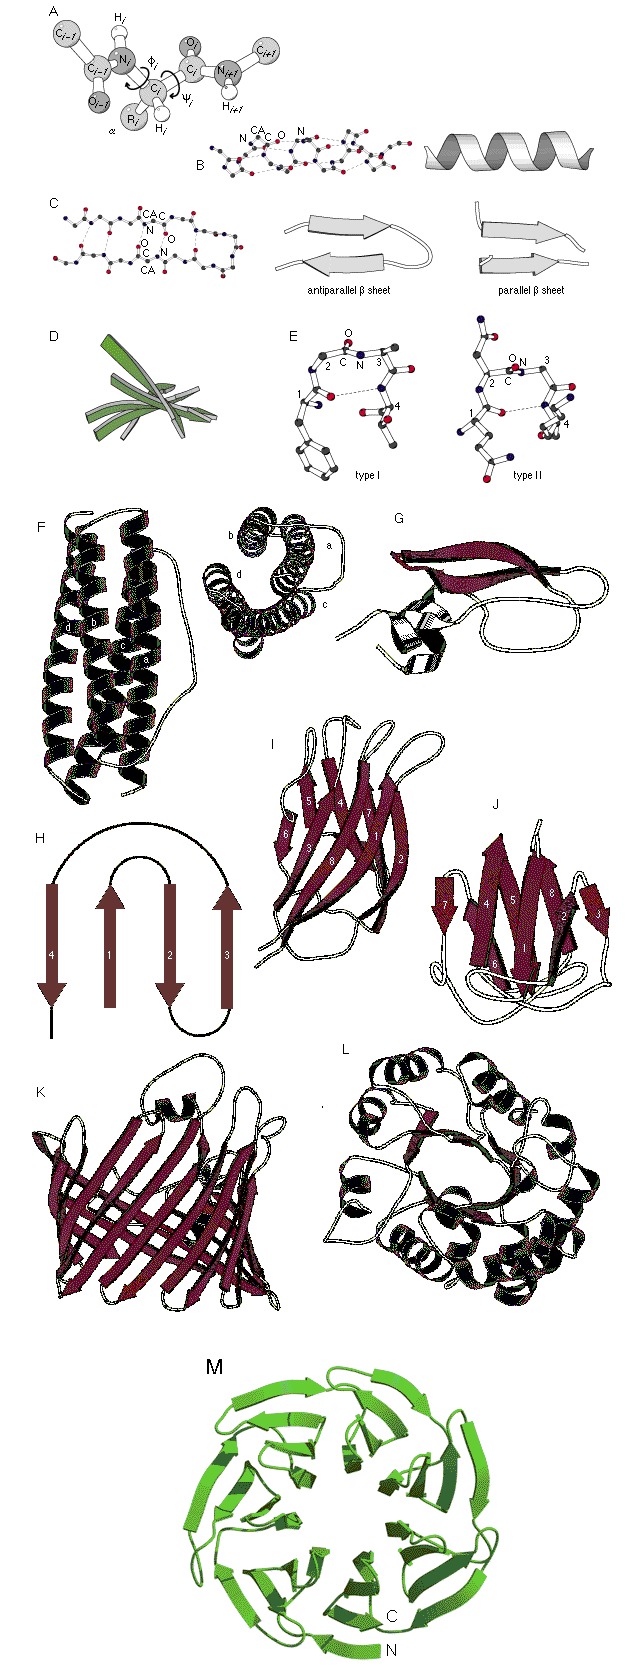
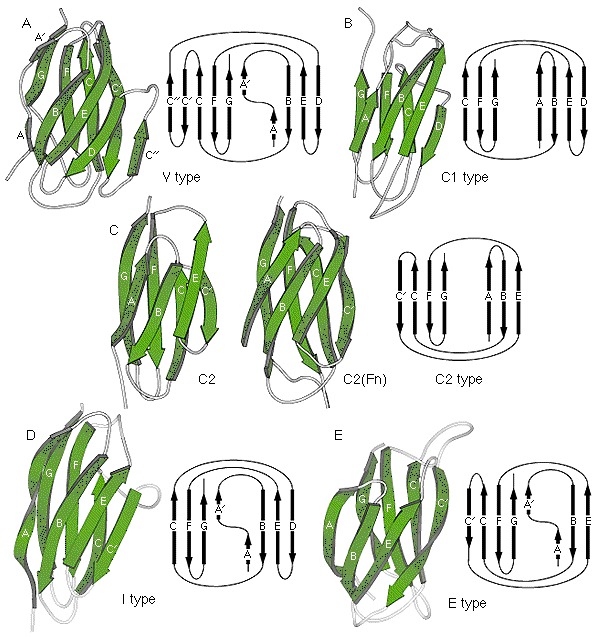
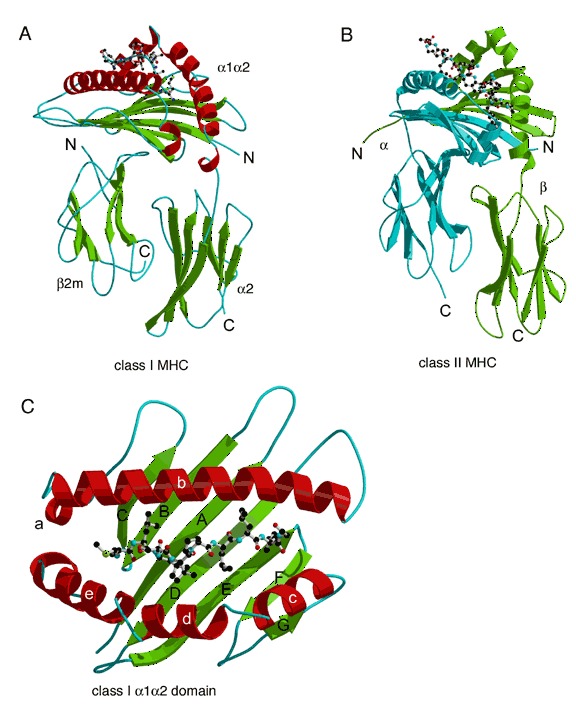
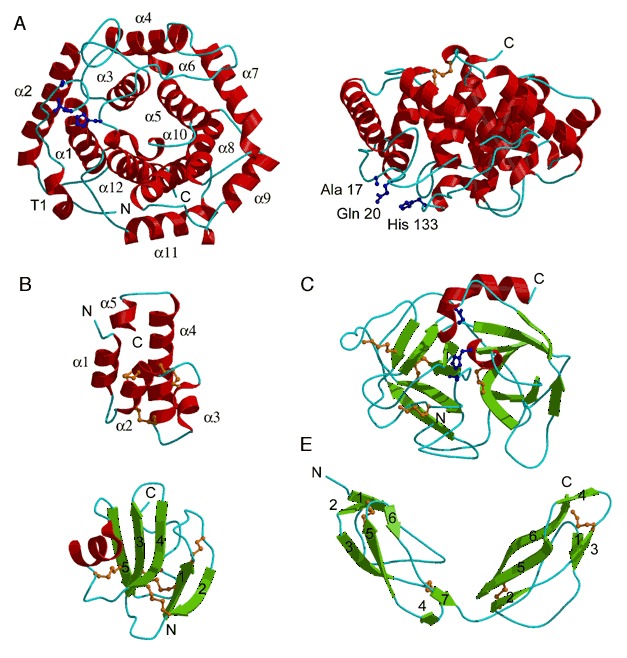
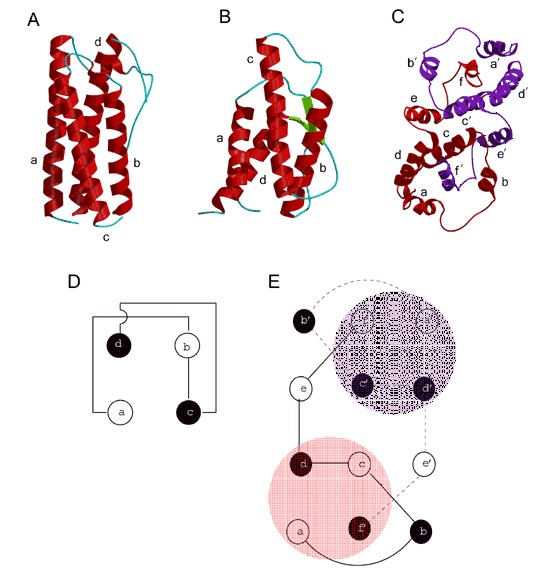
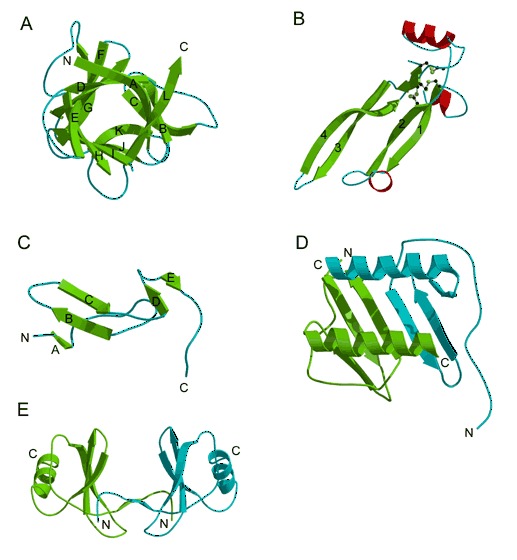
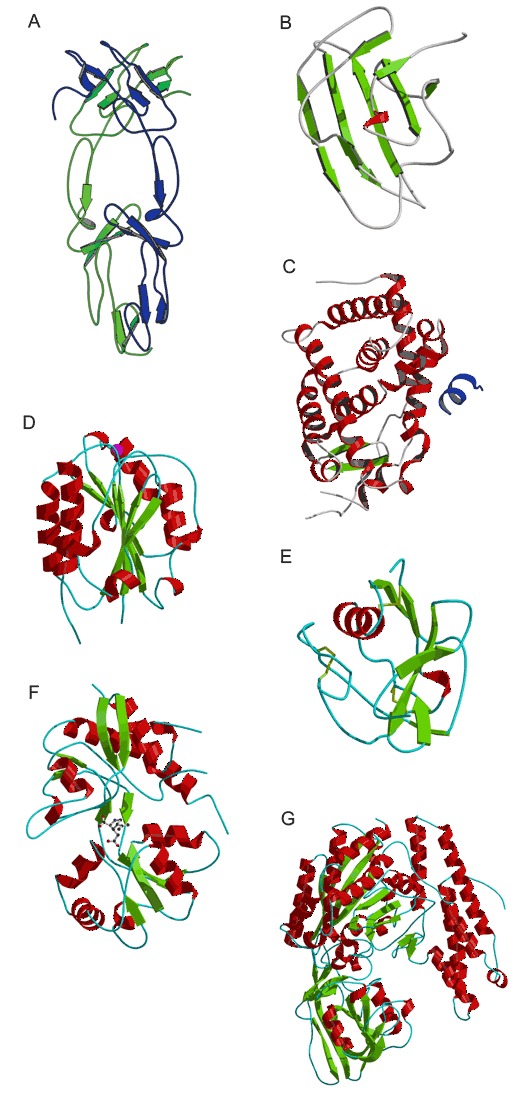
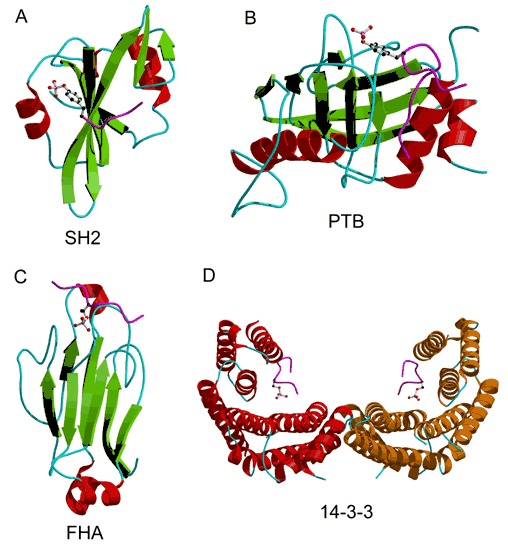
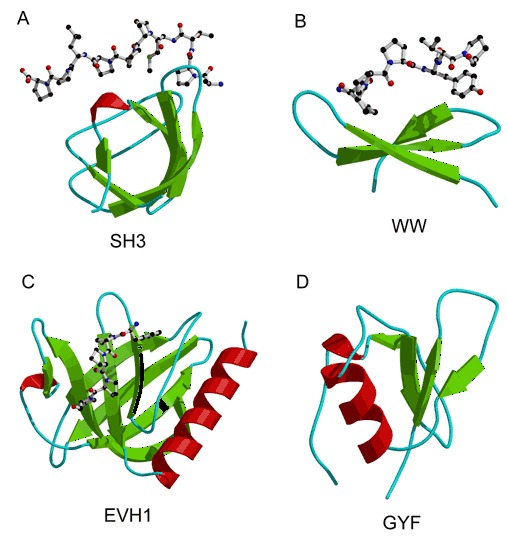
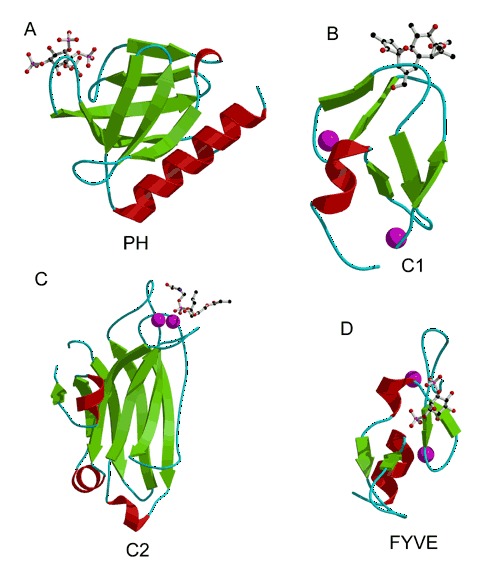
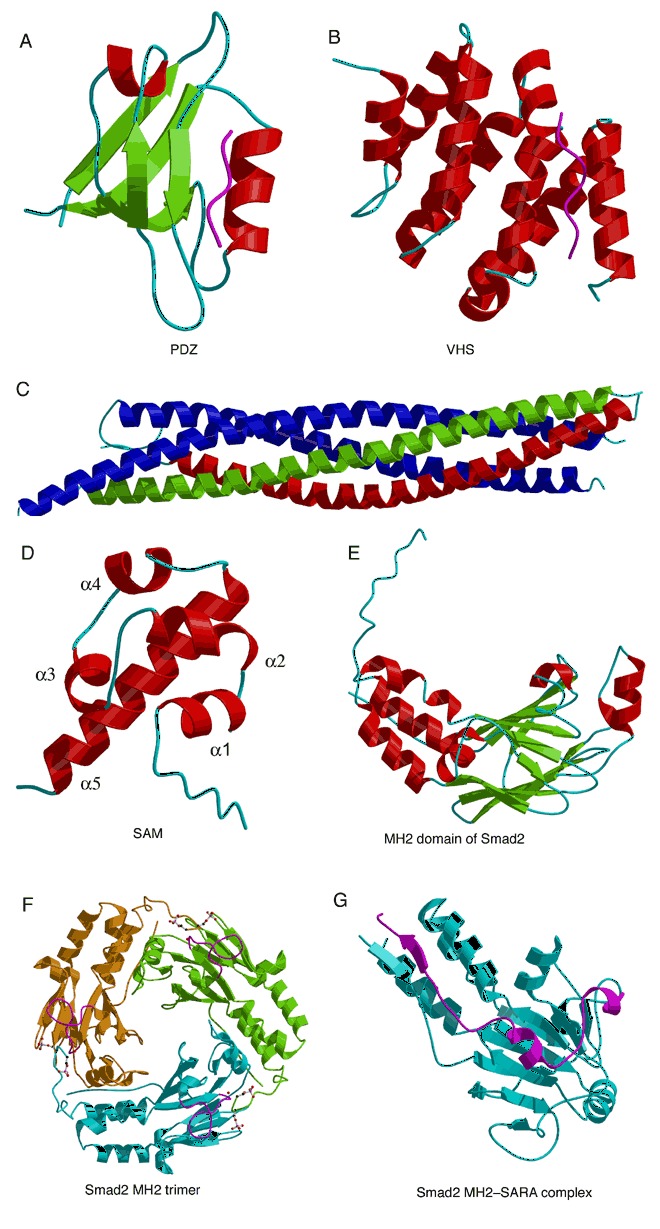
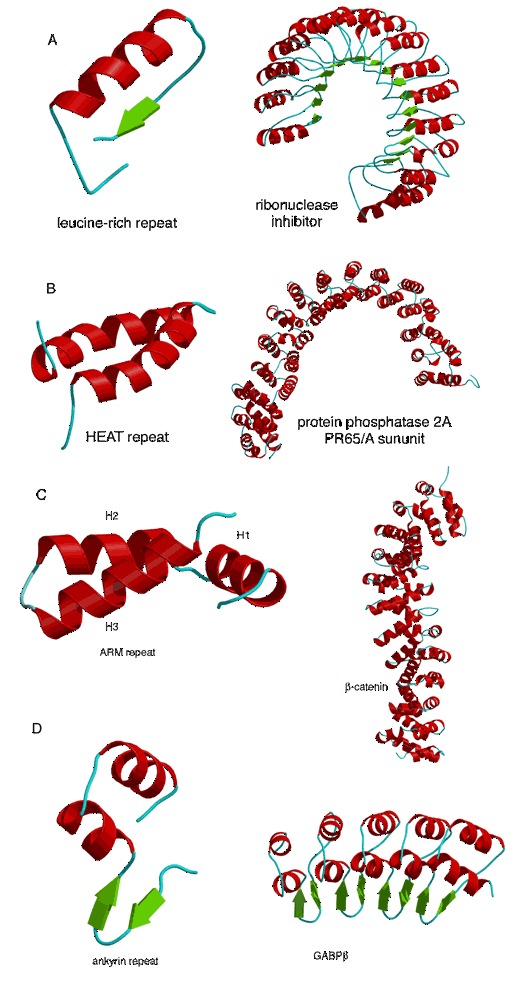
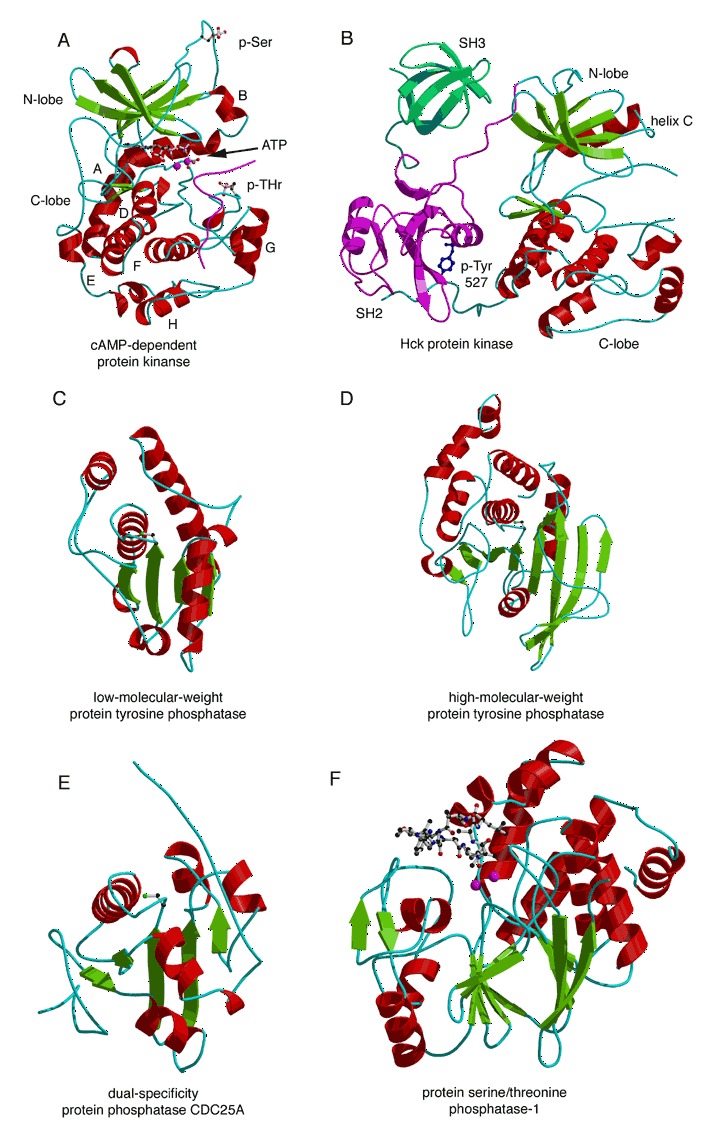
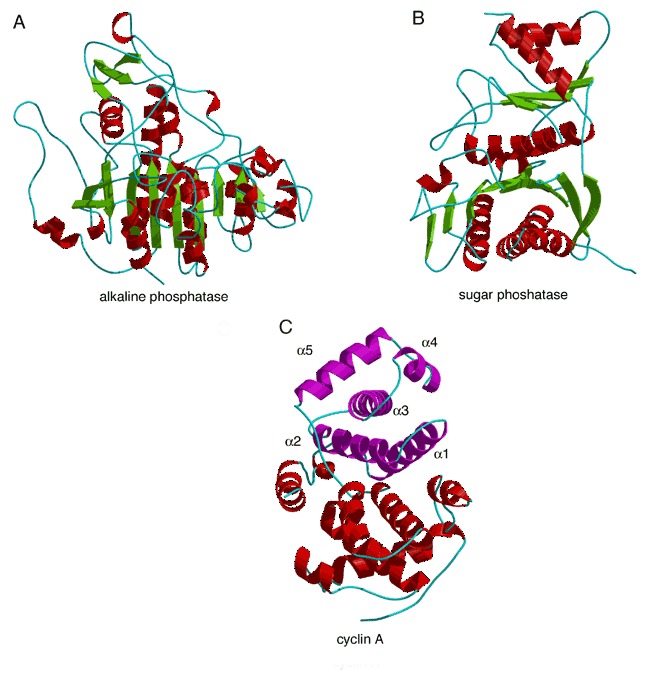
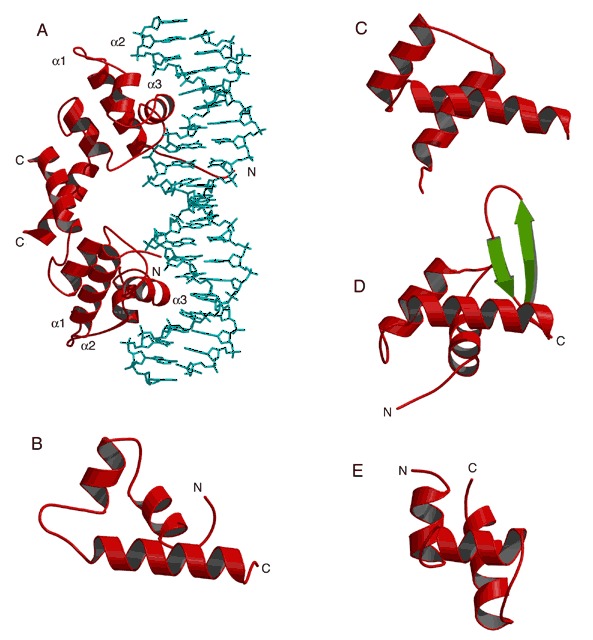
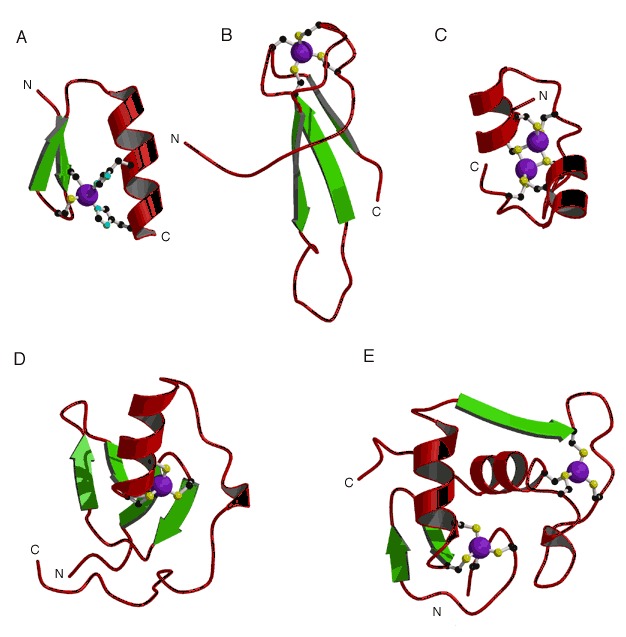
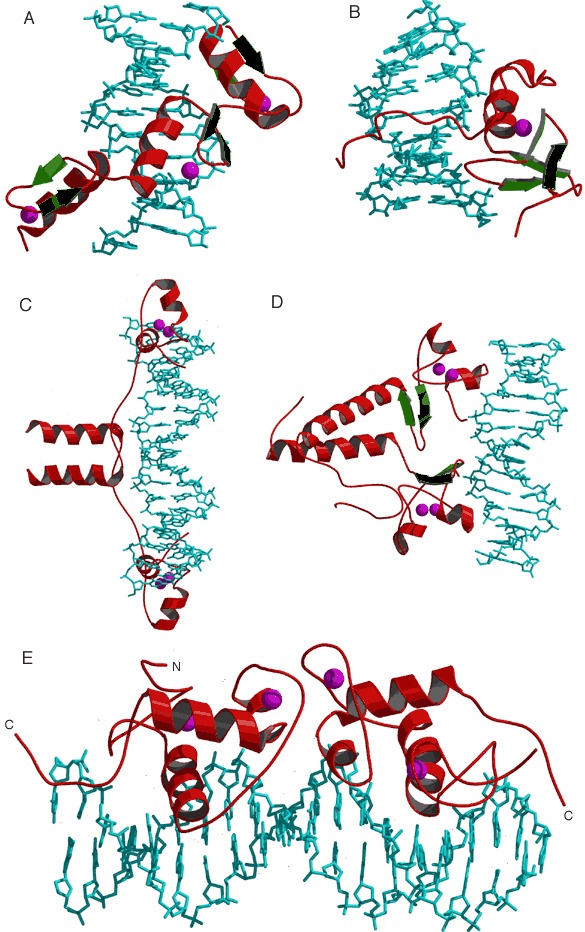
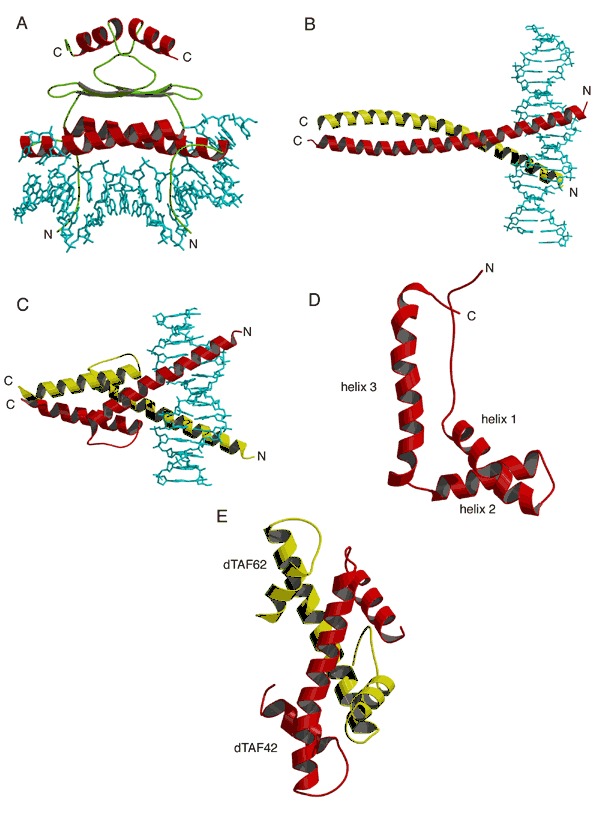
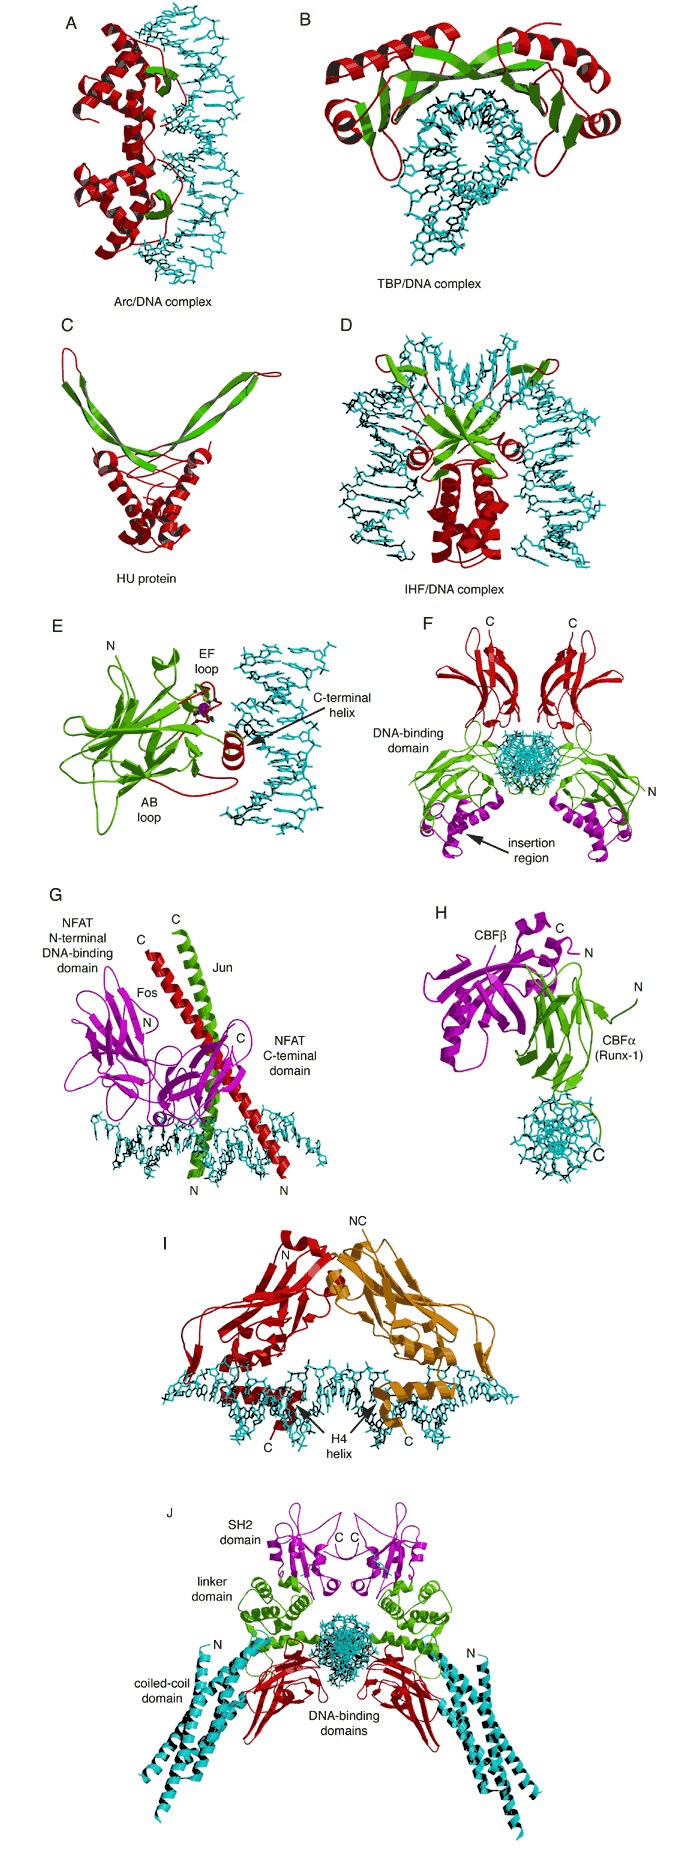
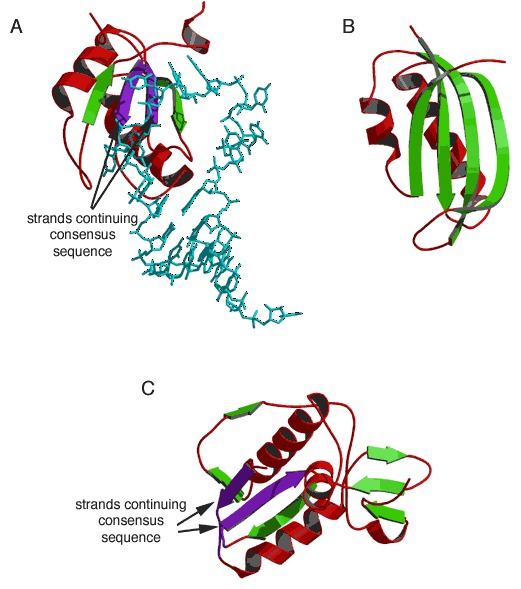
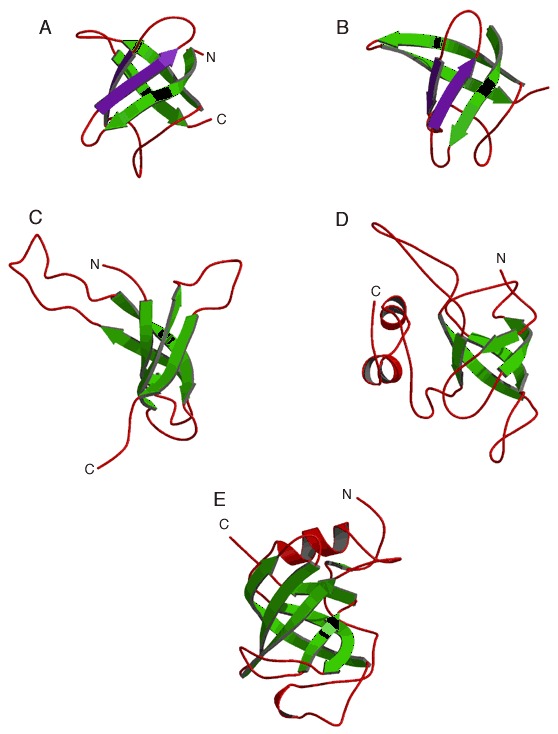
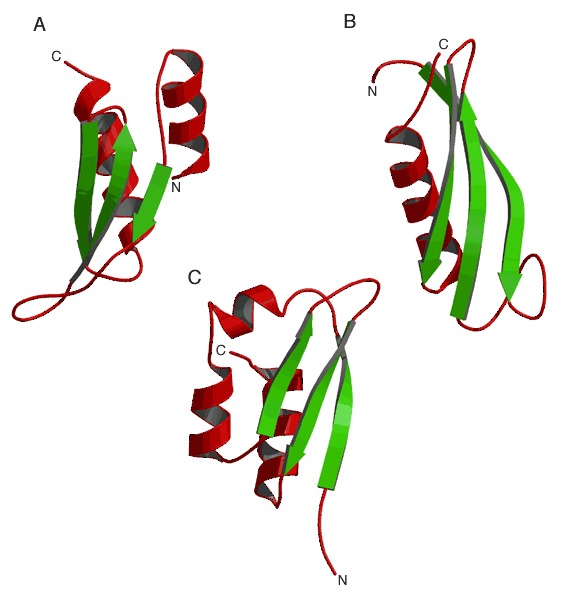
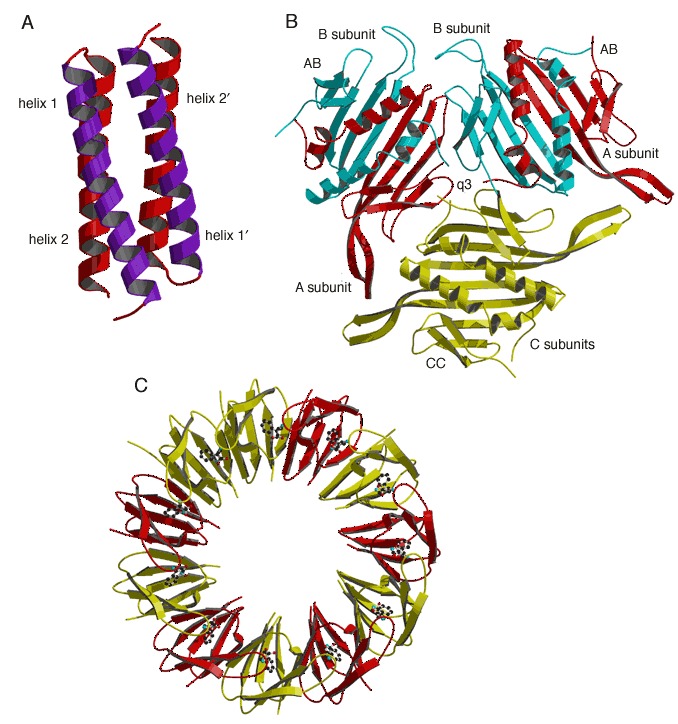
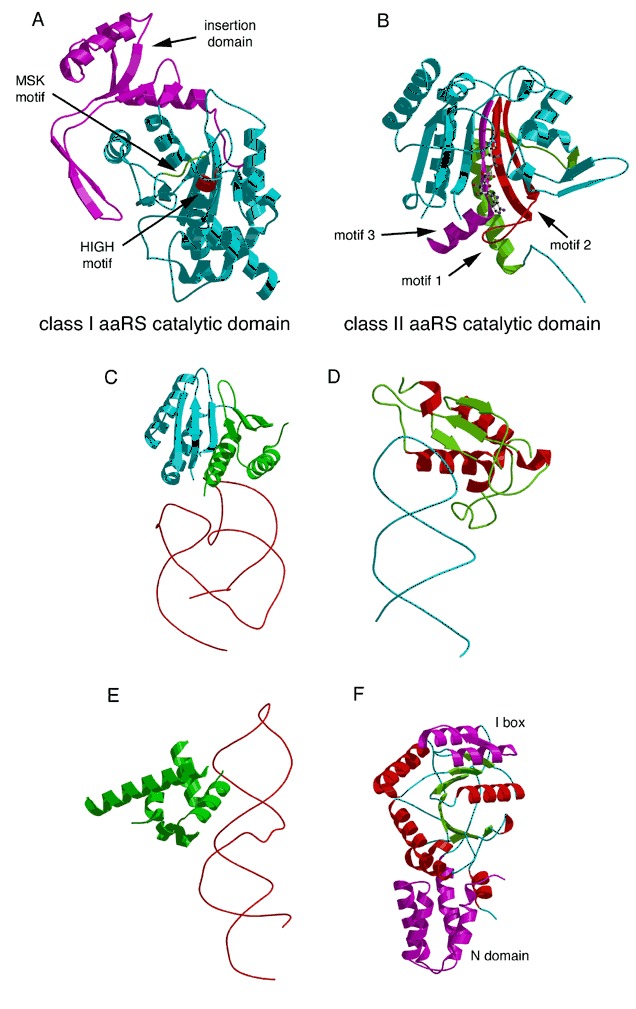
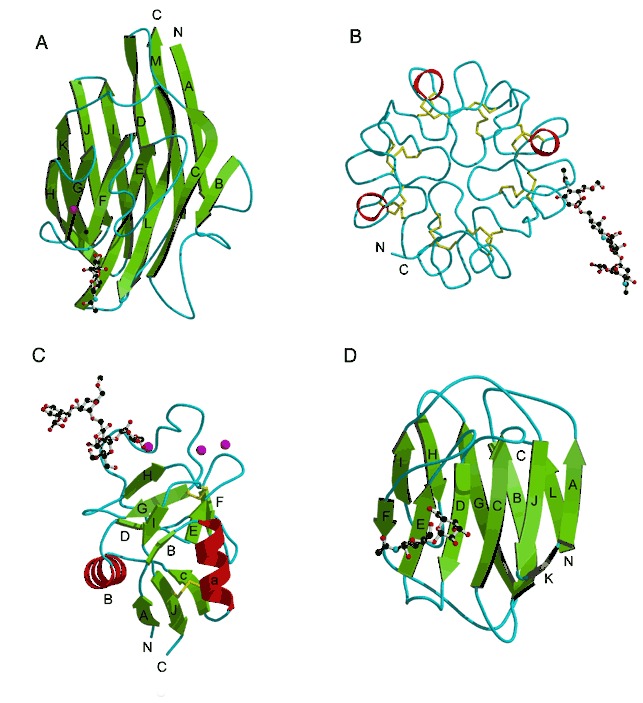
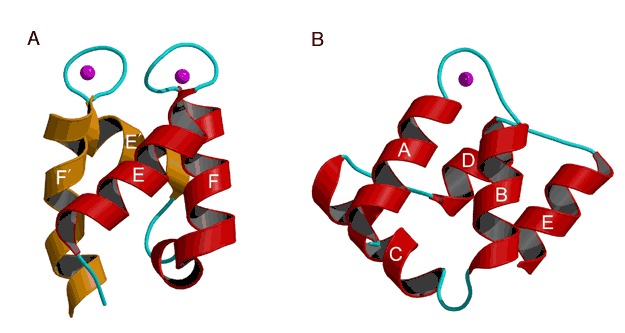
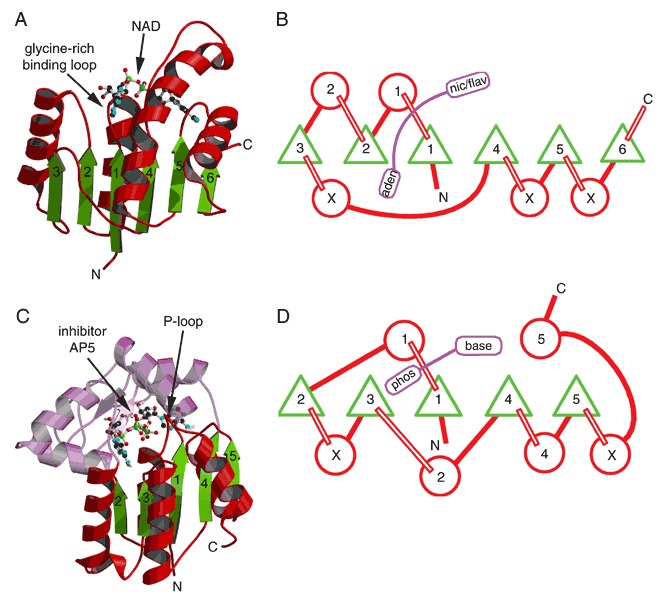
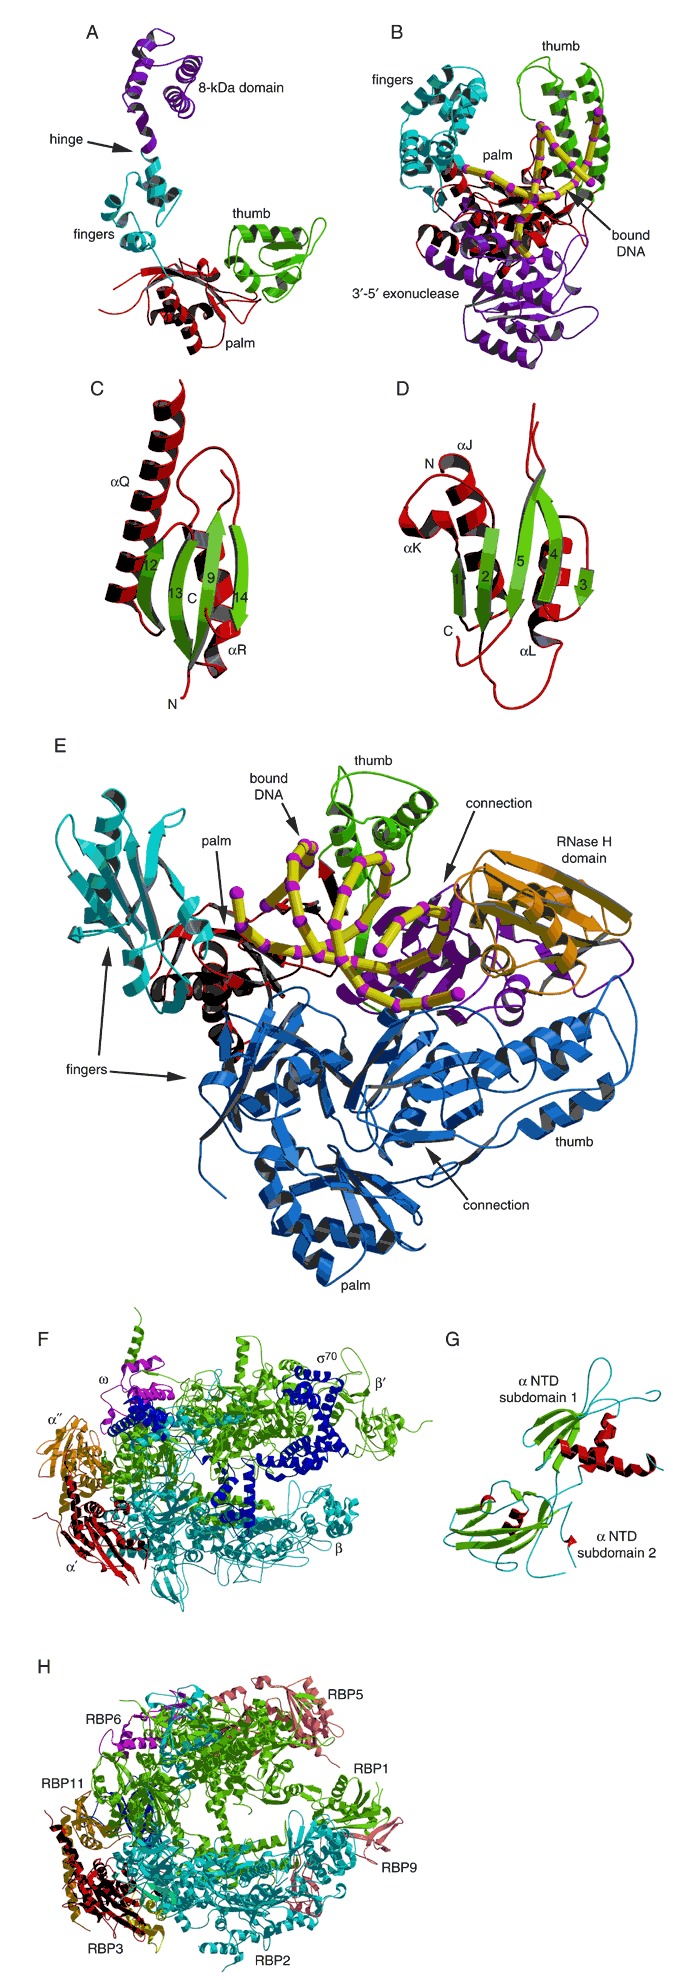
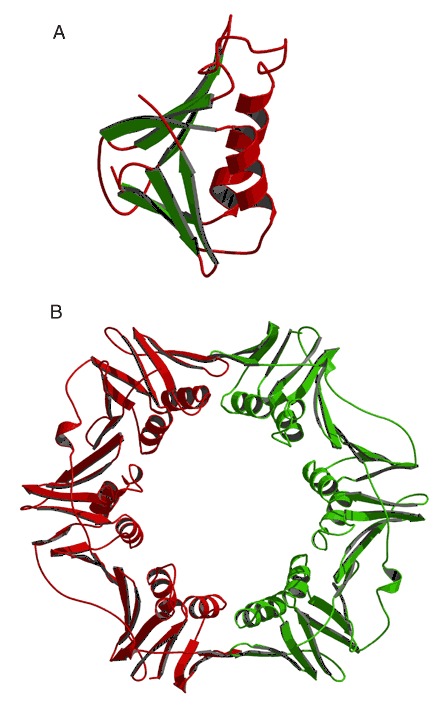
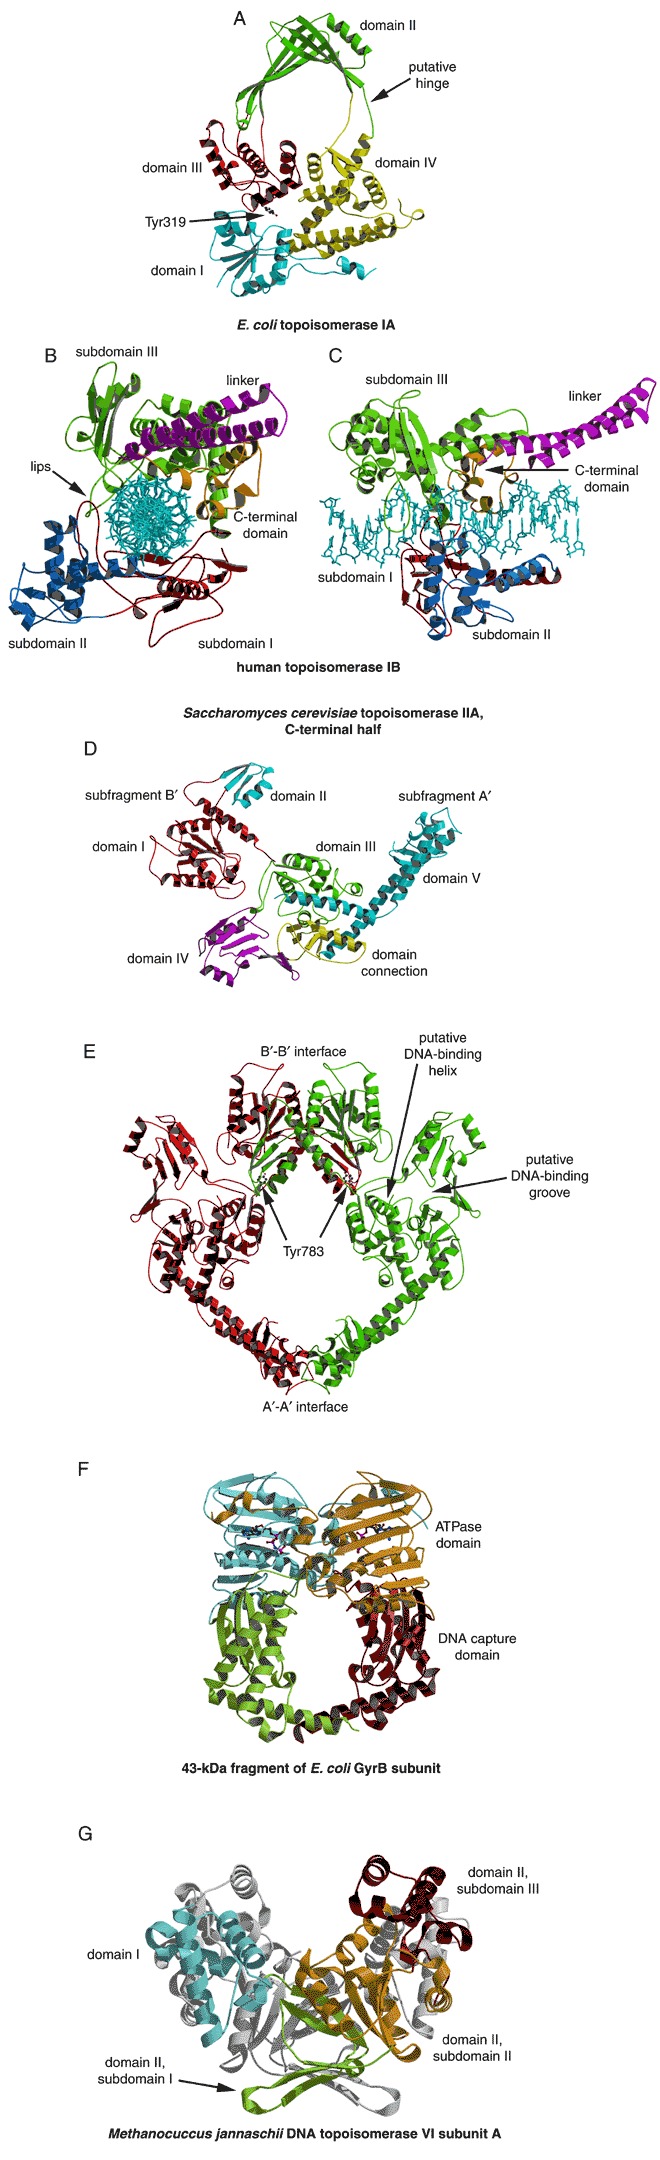
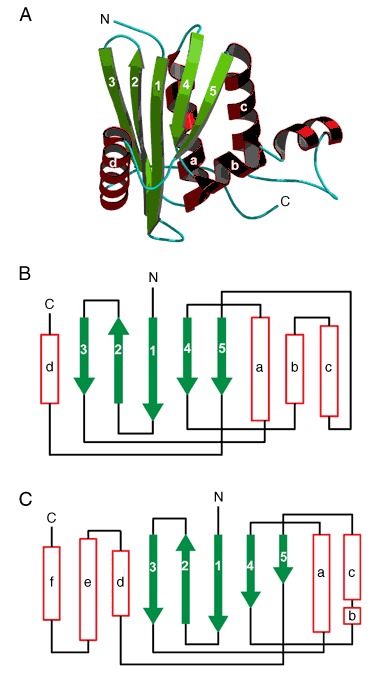
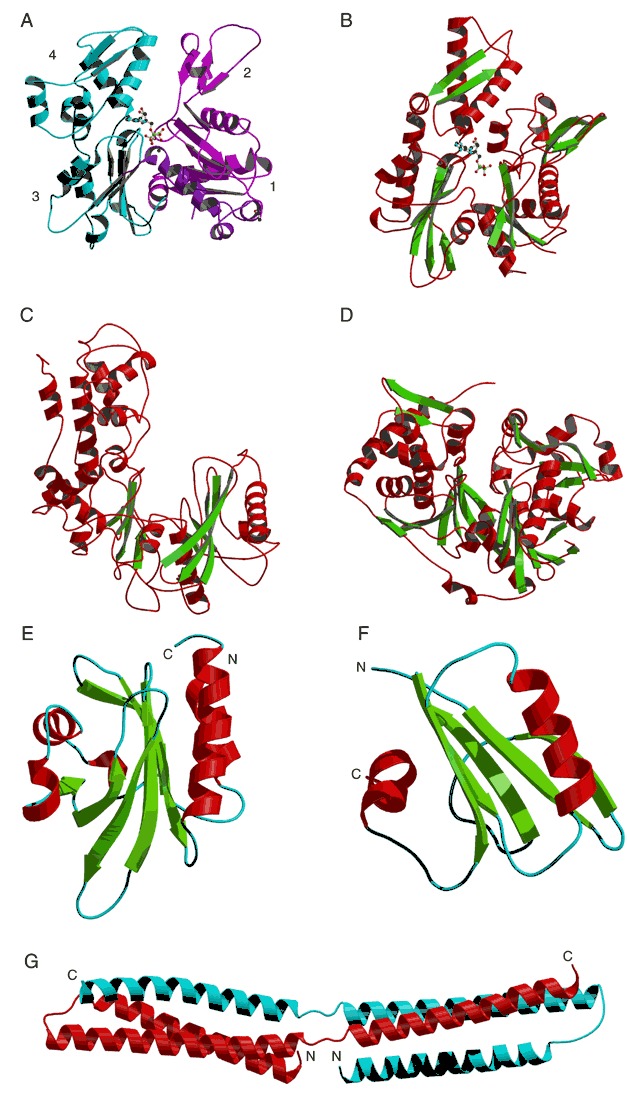
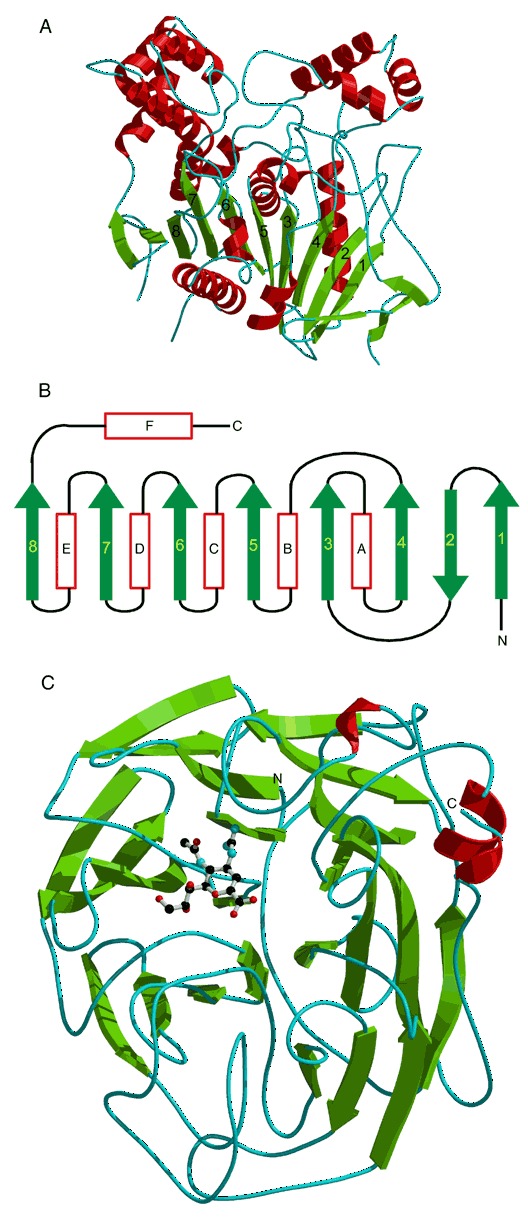
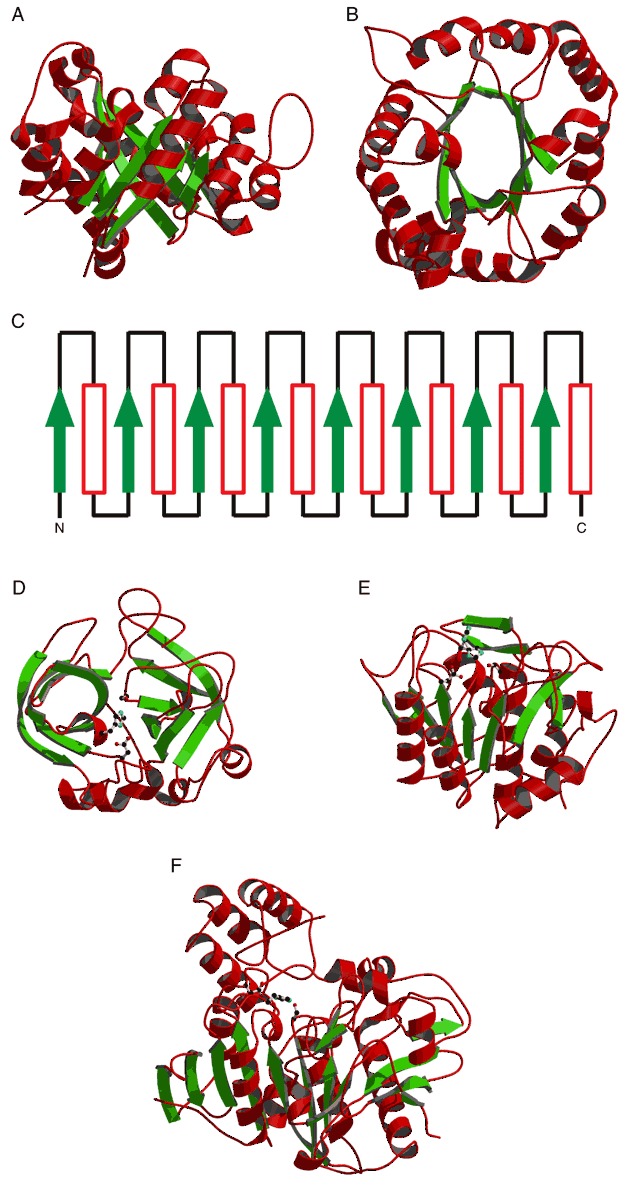
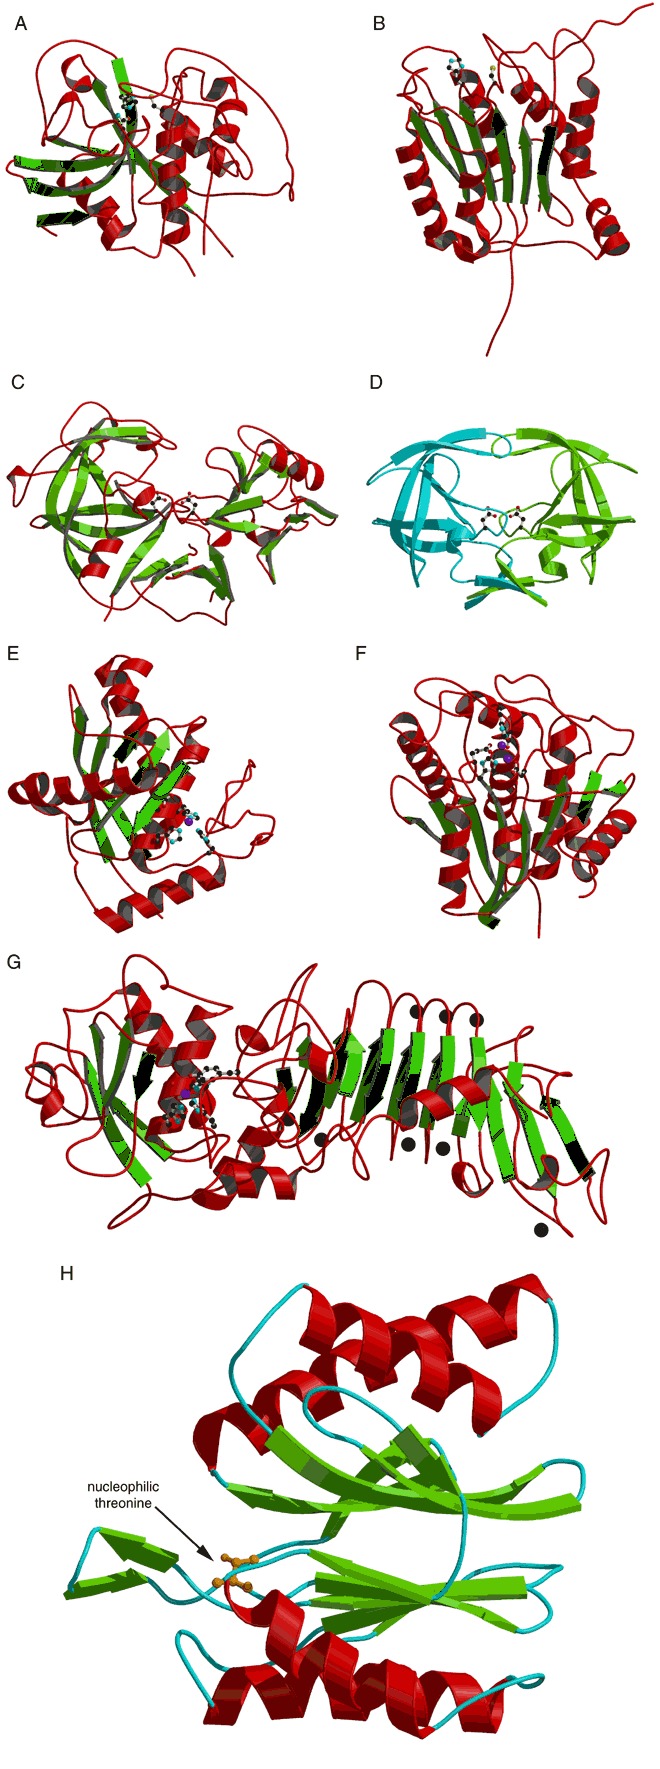
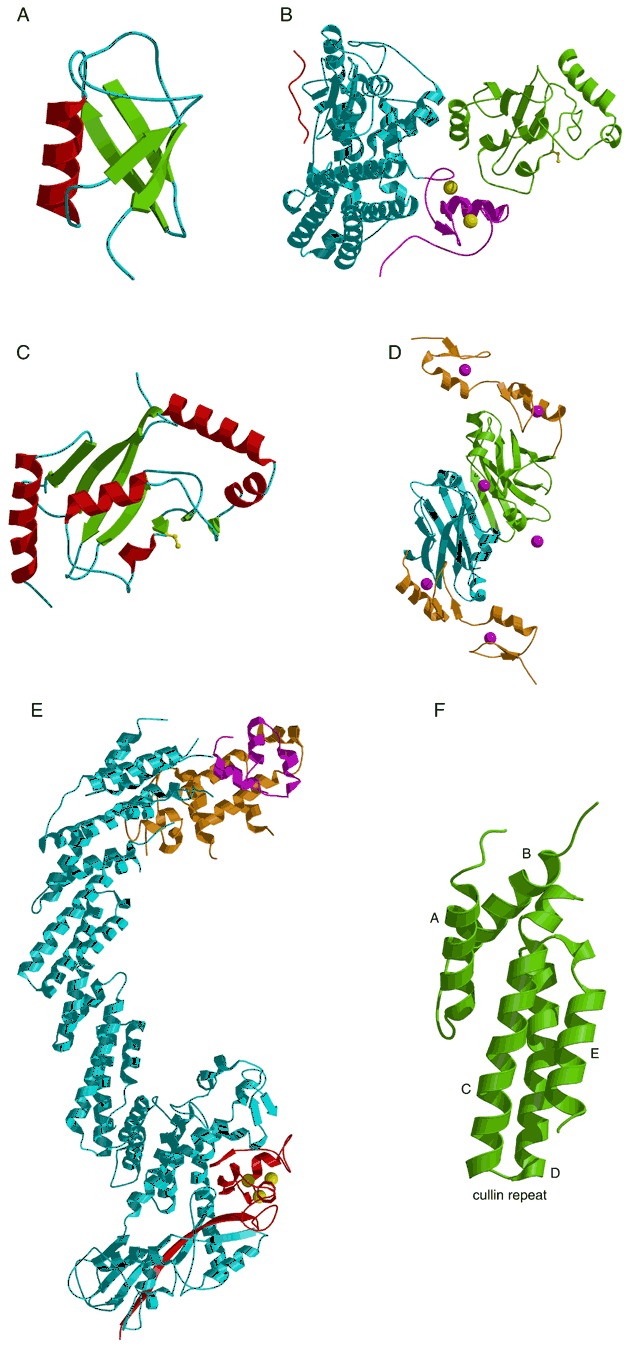
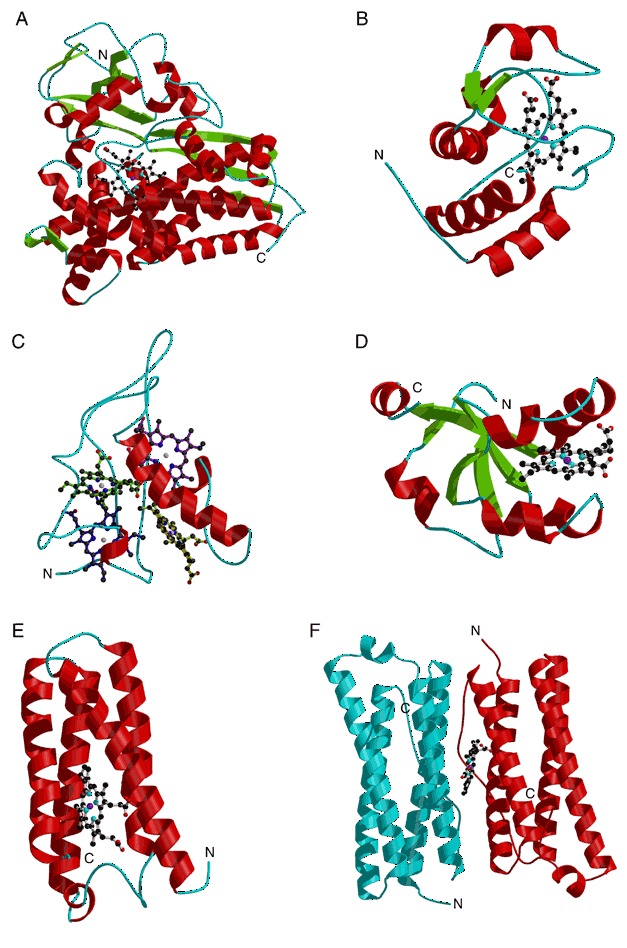
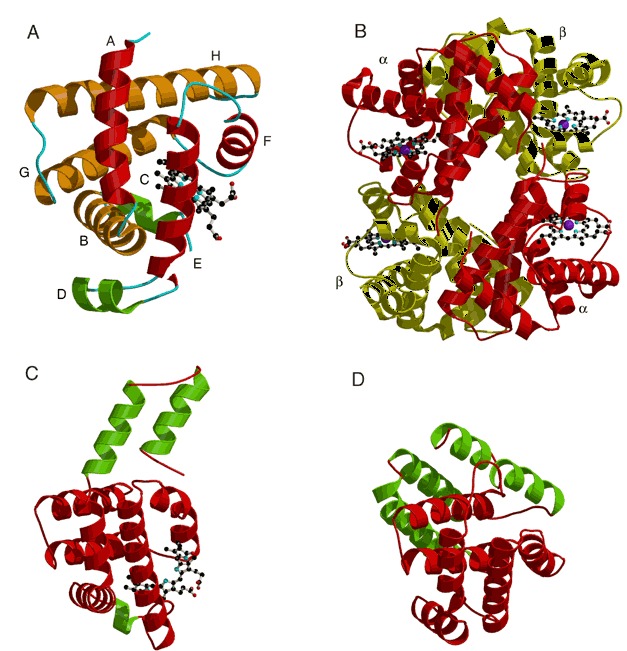
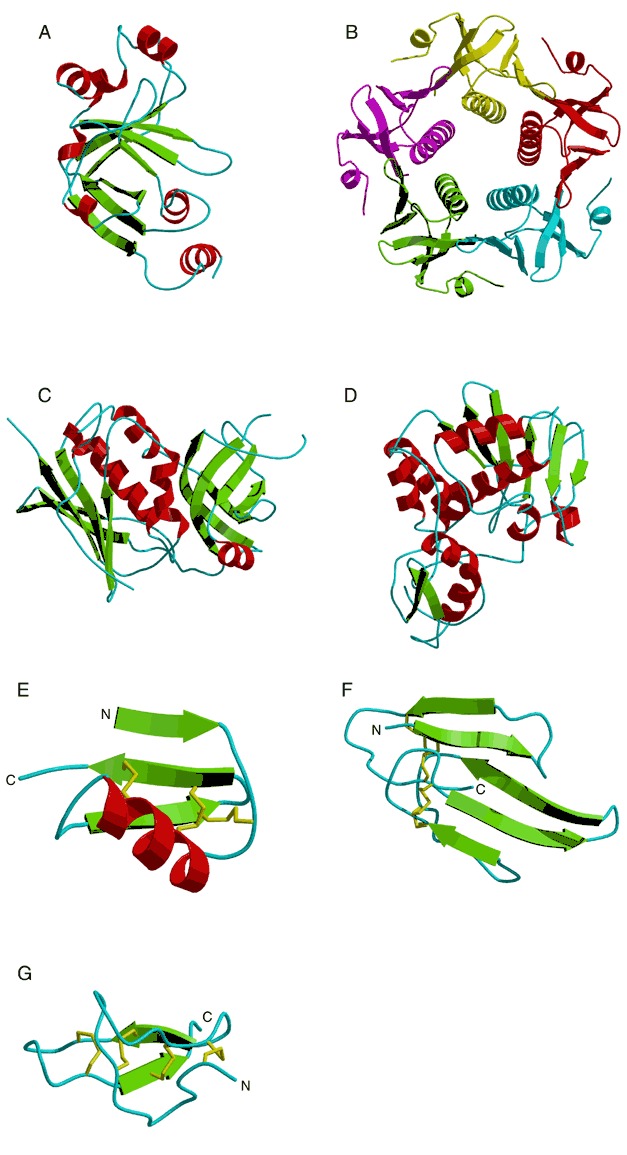
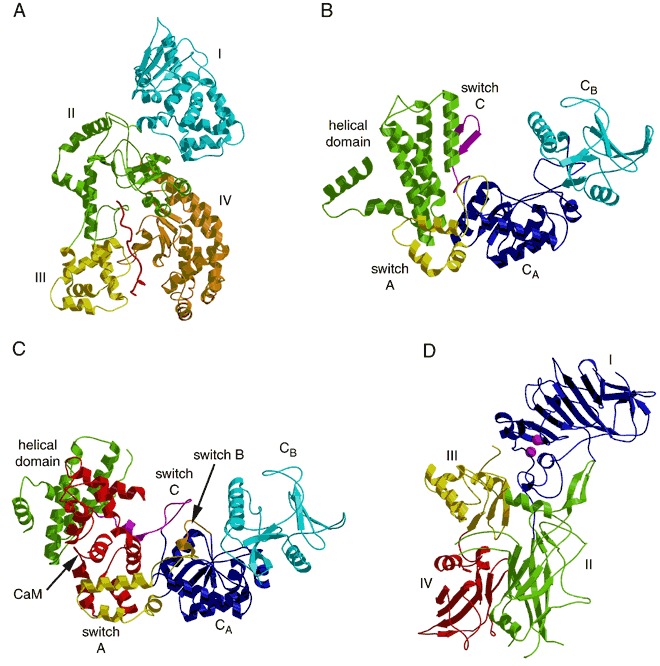
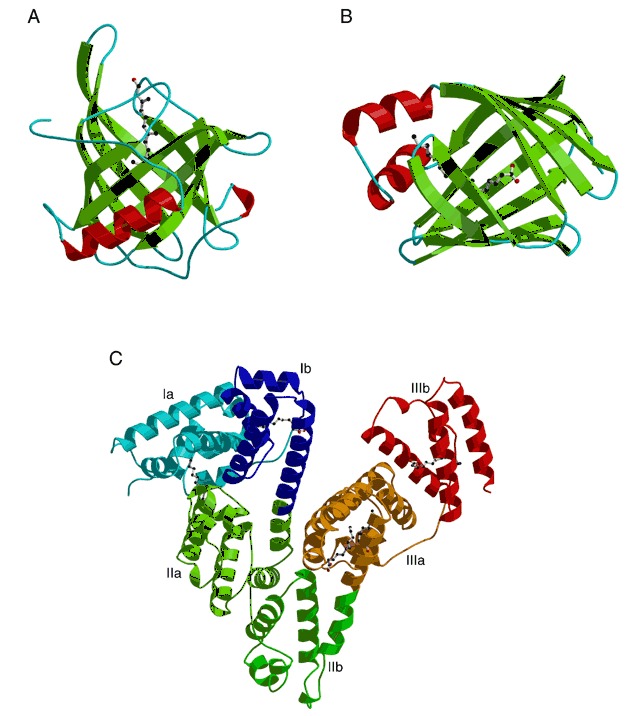
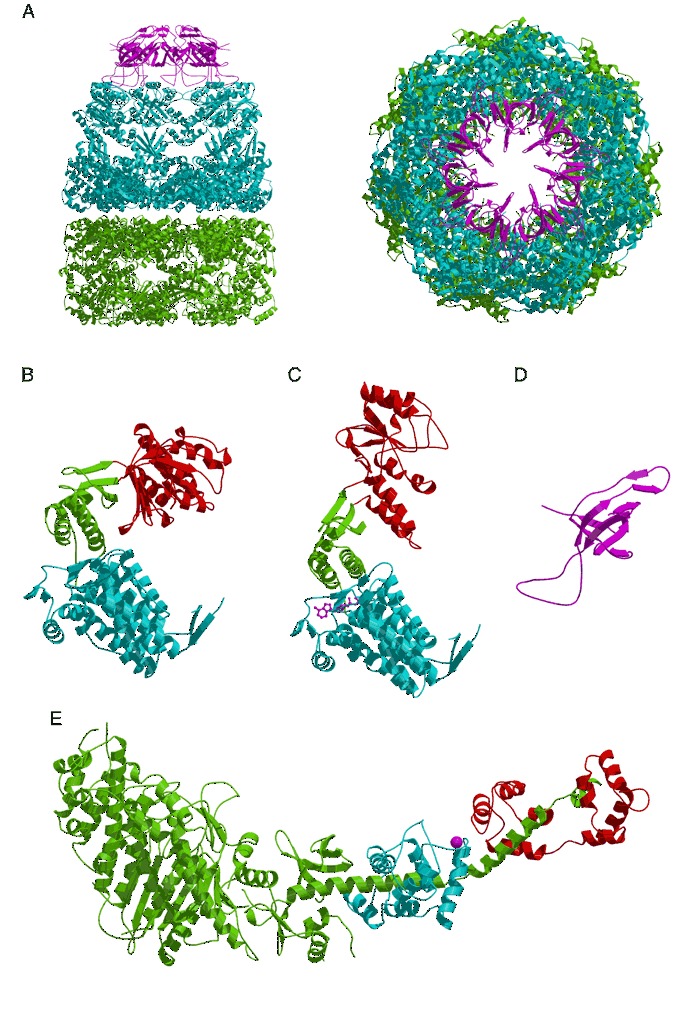
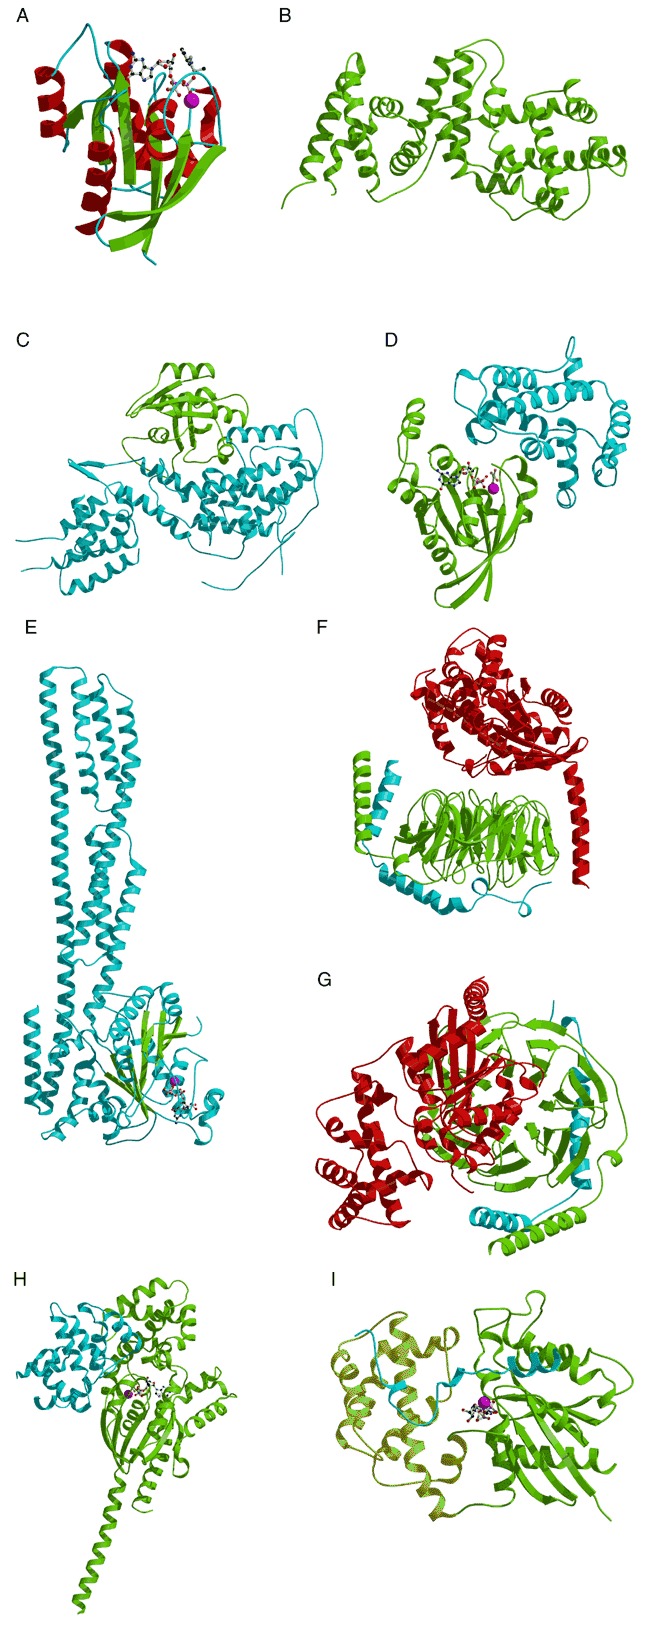
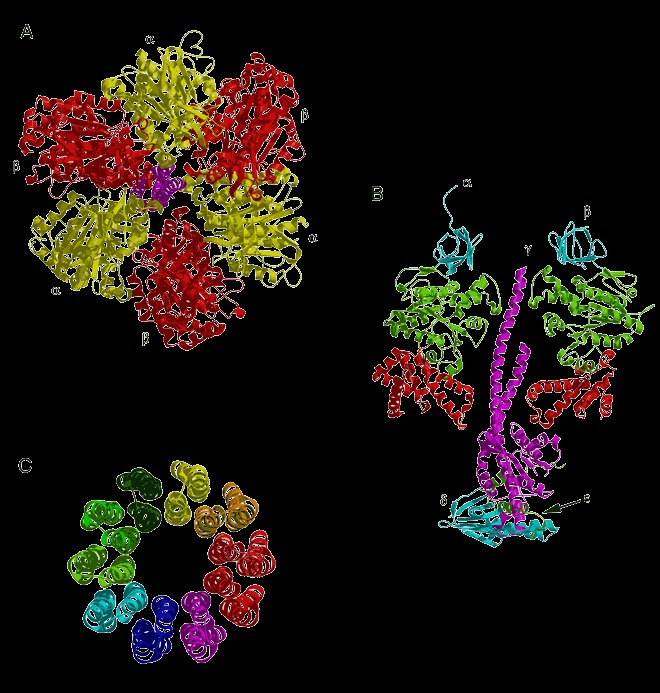
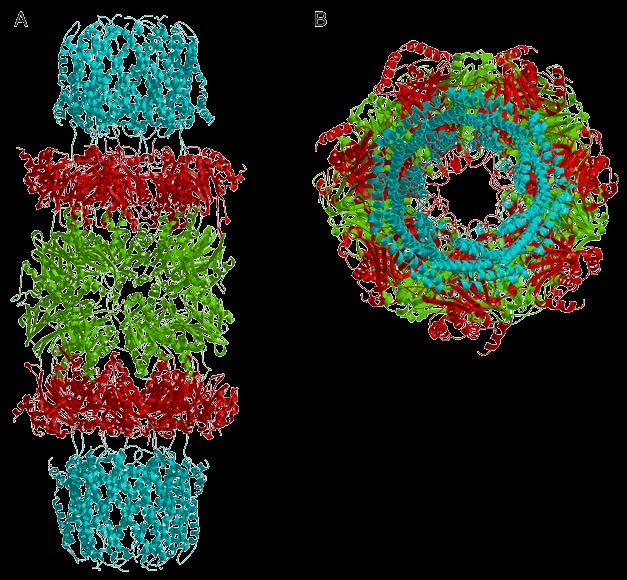
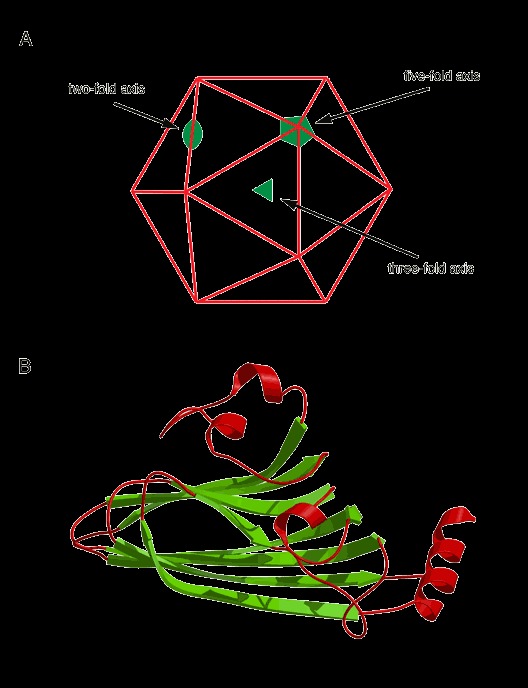
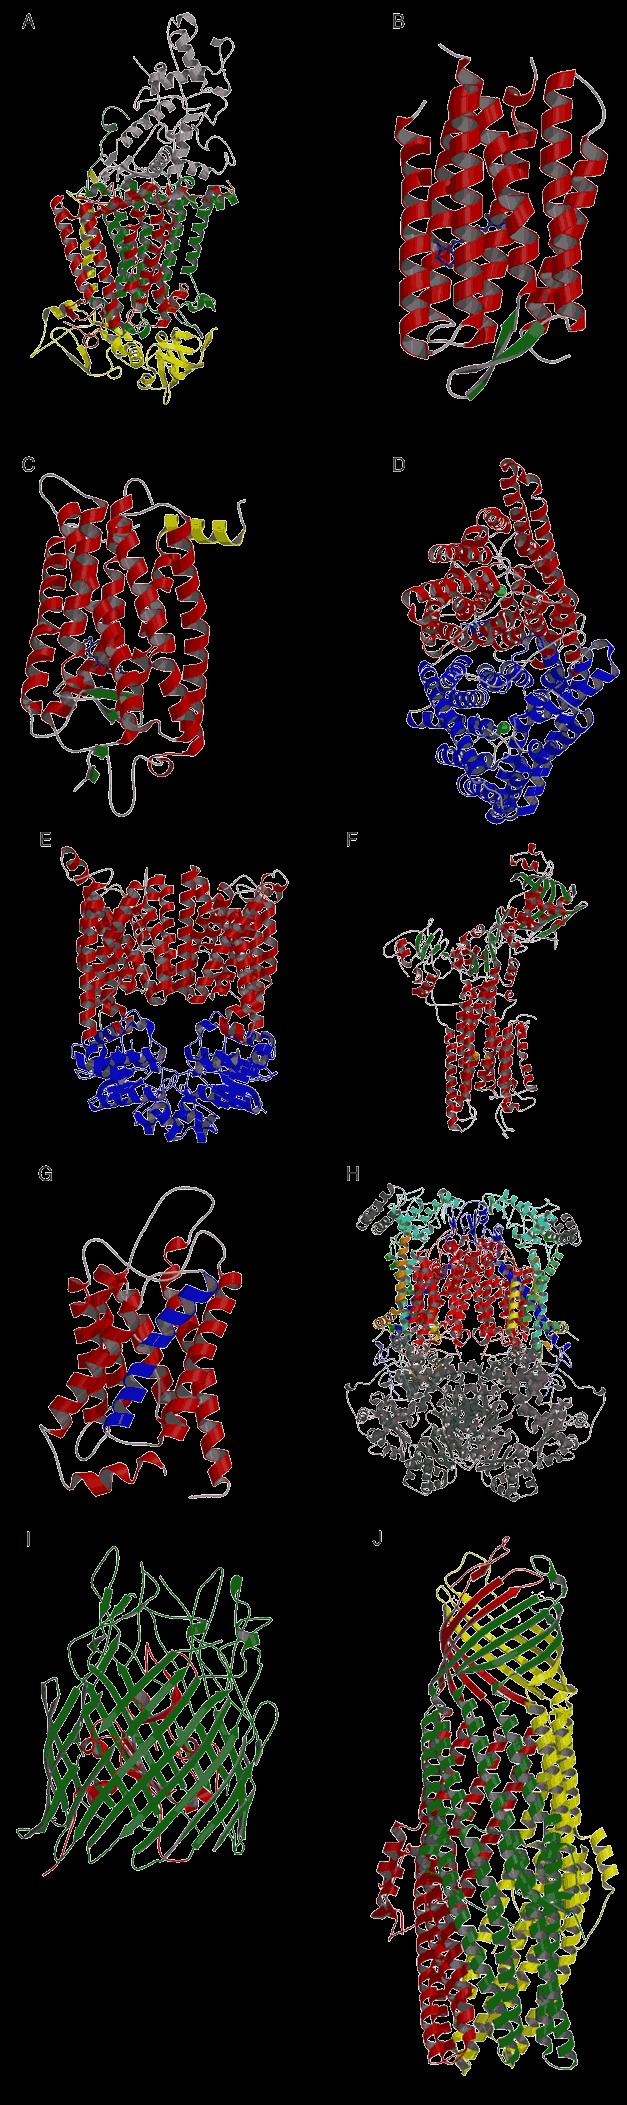
This overview provides an illustrated, comprehensive survey of some commonly observed protein-fold families and structural motifs, chosen for their functional significance. It opens with descriptions and definitions of the various elements of protein structure and associated terminology. Following is an introduction into web-based structural bioinformatics that includes surveys of interactive web servers for protein fold or domain annotation, protein-structure databases, protein-structure-classification databases, structural alignments of proteins, and molecular graphics programs available for personal computers. The rest of the overview describes selected families of protein folds in terms of their secondary, tertiary, and quaternary structural arrangements, including ribbon-diagram examples, tables of representative structures with references, and brief explanations pointing out their respective biological and functional significance.


Figures

Figure 1
Figure 1
(A) Drawing of an l‐polypeptide chain using a ball‐and‐stick model to illustrate torsion angles φ and ψ for residue i. Torsion angle φ defines the angle between the planes specified by atoms Ci‐1–Ni–Ci α and Ni–Ci α–Ci, respectively. Torsion angle ψ defines the angle between the plane specified by atoms Ni–Ci α–Ci and Ci α–Ci–Ni+1 respectively. Also shown are both ball‐and‐stick and ribbon representations of an (B) α‐helix and (C) β‐sheet. The latter is shown in both anti‐ and parallel orientations. (D) Illustration of the characteristic right‐handed twist of a β‐sheet as observed in flavodoxin (PDB entry 1flv). (E) Types I and II tight turns. Examples of commonly observed secondary structure assemblies: (F) four‐helix bundle (top and side view; PDB entry 1bcf), (G) β‐hairpin structure (PDB entry 1bpi), (H) β‐sheet with Greek key topology (topology diagram), (I) jelly‐roll motif (PDB entry 1pgs); (J) β‐sandwich (PDB entry 4gcr), (K) 16‐stranded β‐barrel (PDB entry 2por), (L) α/β‐barrel (PDB entry 1btm), and (M) seven‐bladed β‐propeller (PDB entry 1got).
Figure 2
Figure 2
Tertiary and secondary structures of immunoglobulin fold. The coordinates used for the ribbon diagrams are taken from the PDB entries (A) 3hfl (V type), (B) 1hnf (C1 type), (C) 1fna (C2 type), (D) 1 + tlk (I type), and (E) 1gof (E type).
Figure 3
Figure 3
MHC structures. (A) Class I MHC HLA‐A2 complex (PDB entry 2clr) and (B) class II MHC complex HLA‐DR1 (PDB entry 1dlh), each with an antigenic peptide. The α and β chains in (B) are colored blue and green respectively. The peptide is shown as a ball‐and‐stick model. (C) Close‐up view of the α1α2 peptide‐binding domain of HLA‐A2 (PDB entry 2clr).
Figure 4
Figure 4
Protein folds in the complement system. (A) C3d (PDB entry 1c3d; residues 996 to 1287). Left side shows the view down the barrel axis; the right side shows the side view of the barrel. The α helices are numbered 1 to 12 and the N‐terminal 310 helix is labeled T1. The residues critical for covalent attachment to the pathogen surface, His 133, Gln 20, and Ala 17 (Cys residue in the wild type protein), are represented by a ball‐and‐stick model. (B) C5a (PDB entry 1kjs).The α helices are numbered from 1 to 5 (C) Complement factor D serine protease (PDB entry 1dsu). Catalytic residues His 57, Asp 102, and Ser 195 are represented by a ball‐and‐stick model. (D) Complement regulatory protein CD59 (PDB entry 1cdq; residues 1 to 70). The β strands are numbered according to their order in the protein sequence. (E) CCP modules 15 and 16 from complement factor H (PDB entry 1hfh). The β strands for each separate CCP module are numbered according to their order in the protein sequence.
Figure 5
Figure 5
Long and short‐chain cytokines. The structure of (A) a long‐chain helical cytokine, GCSF (PDB entry 1rhg), (B) a short‐chain helical cytokine, IL‐4 (PDB entry 1rcb), and (C) interferon‐γ (PDB entry 1rfb). The two monomers of interferon‐γ are shown in red and purple. (D) Connectivity between helices in four‐helix bundle cytokines. The up helices are drawn in white and the down helices are in black. (E) Connectivity between helices of IFN‐γ. The block shaded regions correspond to the four‐helix bundles.
Figure 6
Figure 6
Cytokines and chemokines. (A) Human IL‐1β, a member of the β‐trefoil fold. (PDB entry 1hib). (B) Human transforming growth factor‐β2 (PDB entry 2tgi). The four strands that define the cysteine‐knot fold are shown in green (Anderson et al., 1978). The six knotted cysteines are shown in ball‐and‐stick model (with yellow sulfur atoms). (C) Murine EGF (PDB entry 1epj). (D) CXC chemokine (PDB entry 1il8), (E) CC chemokine (PDB entry 1rto).
Figure 7
Figure 7
The structures of (A) tumor necrosis factor receptor TNFR (PDB entry 1tnr), (B) type II TGF‐β receptor (PDB entry 1ktz), (C) thyroid hormone receptor (PDB entry 1bsx), (D) integrin I domain (PDB entry 1lfa), (E) scavenger receptor (PDB entry 1by2), (F) glutamate receptor (PDB entry 1gr2) bound to the neurotoxin kainate (ball‐and‐stick model), and (G) transferrin receptor (PDB entry 1cx8).
Figure 8
Figure 8
Folds that bind phosphopeptides. The phosphopeptides are shown as magenta colored worms. The phosphorylated amino acid is represented by a ball‐and‐stick model. (A) The SH2 domain from v‐src tyrosine kinase bound to a five‐residue phosphotyrosine peptide (PDB entry 1sha). (B) PTB domain from shc complexed with a twelve‐residue phosphotyrosine peptide (PDB entry 1shc). (C) FHA domain from protein kinase RAD53 complexed to a twelve‐residue phosphothreonine peptide (PDB entry 1g6g). (D) Homodimer of 14‐3‐3 protein ζ bound to eight‐residue phosphoserine peptides (PDB entry 1qja).
Figure 9
Figure 9
Folds that bind to polyproline peptides. Bound polyproline peptides are represented by ball‐and‐stick models. (A) An SH3 domain from the Abl tyrosine kinase complexed with the ten‐residue synthetic peptide 3Bp‐1 (PDB entry 1abo). (B) A WW domain from dystrophin in complex with a seven‐residue β‐dystroglycan peptide (PDB entry 1eg4). (C) An EVH1 domain from Enabled, bound to the Acta peptide (PDB entry 1evh). (D) GYF domain from CD2Bp2 (PDB entry 1gyf).
Figure 10
Figure 10
Phospholipid‐binding domains. Lipid ligands are displayed as ball‐and‐stick models and metal cations are represented by magenta spheres. (A) Pleckstrin homology (PH) domain from Dappl/Phish complexed with inositol 1,3,4,5‐tetrakisphosphate (PDB entry 1fao). (B) C1 domain from protein kinase Cδ complexed with phorbol‐13‐acetate (PDB entry 1ptr). (C) C2 domain from protein kinase C(α) complexed with Ca2+ and phosphatidylserine (PDB entry 1dsy). (D) A FYVE domain from EEA1 bound to inositol 1,3‐diphosphate (PDB entry 1joc).
Figure 11
Figure 11
Protein interaction domains. Bound peptides are represented by magenta worms. (A) The syntrophin PDZ domain bound to the peptide GVKESLV (PDB entry 2pdz). (B) VHS domain of GGA1 complexed with cation‐independent mannose‐6‐phosphate receptor C‐terminal peptide (PDB entry 1jwg). (C) SNARE fusion complex containing syntaxin‐1A (green), synaptobrevin‐II (red), and SNAP‐25B (blue; PDB entry 1sfc). (D) SAM domain from human EPHB2 receptor (PDB entry 1b4f). (E) MH2 domain from human Smad2 (PDB entry 1khx). (F) Homotrimer of a phosphorylated MH2 domain from human Smad2 (PDB entry 1khx). Phosphorylated Ser465 and ‐467 are represented by ball‐and‐stick models. The phosphoserine binding loop L3 is shown in magenta. (G) Complex of the Smad2 MH2 domain (cyan) with the SARA complex (magenta; PDB entry 1dev).
Figure 12
Figure 12
Structural repeat motifs. (A) A single Leu‐rich repeat (left) from ribonuclease inhibitor (right; PDB entry 2bnh). (B) A HEAT repeat (left) from the PR65/A subunit of protein phosphatase 2A (right; PDB entry 1b3u). (C) An ARM repeat (left) from β‐catenin (right; PDB entry 2bct). (D) An ankyrin repeat (left) from GABPβ (right; PDB entry 1awc).
Figure 13
Figure 13
Protein kinase and phosphatase structures. (A) The structure of phosphorylated cyclic AMP‐dependent protein kinase complexed with ATP, Mn, and inhibitor (PDB entry 1atp). The peptide inhibitor is represented by a magenta worm. The ATP, Mn, and phosphorylated serine and threonine are shown as ball‐and‐stick models. (B) The structure of the inactive form of hematopoietic cell kinase of the Src family of protein kinases (PDB entry 1ad5). The SH3 and SH2 domains are colored blue‐green and magenta, respectively, and the catalytic domain is colored green and red. The phosphorylated tyrosine 572 is represented by a blue ball‐and‐stick model. The following protein phosphatases are all shown in approximately the same orientation with the catalytic cysteine displayed as a ball‐and‐stick model. (C) Low‐molecular‐weight protein tyrosine phosphatase (PDB entry 1phr). (D) High‐molecular‐weight protein tyrosine phosphatase‐1B (PDB entry 2hnq). (E) Dual‐specificity protein phosphatase CDC25A (PDB entry 1c25). (F) Protein serine/threonine phosphatase‐1 of the PPP family (PDB entry 1fjm).
Figure 14
Figure 14
Phosphatase, kinase, and related structures. (A) Alkaline phosphatase (PDB entry 1ali). (B) Fructose‐1,6‐bisphosphatase (PDB entry 5fbp) as a representative of the sugar phosphatase fold. (C) Cyclin A (PDB entry 1fin). The N‐terminal cyclin box domain is colored magenta.
Figure 15
Figure 15
Variations of the helix‐turn‐helix (HTH) structural motif and the MADS box. The recognition helix is oriented horizontally in all but panel A. (A) Homodimer of the DNA‐binding domain of λ repressor bound to DNA (PDB entry 1lmb). The three helices of the HTH motif are labeled α1, α2, and α3 in each monomer. Both recognition helices (α3) sit in the major groove. (B) λ repressor (prokaryotic HTH; PDB entry 1lmb). (C) Engrailed homeodomain (PDB entry 1hdd). (D) Globular domain of histone H5 (PDB entry 1hst). This example of the winged helix motif has only one wing (the β hairpin). (E) Purine repressor (purR; PDB entry 1pru).
Figure 16
Figure 16
Zinc‐binding motifs within DNA‐binding domains. The zinc atom and side‐chain ligands to the zinc are represented by ball‐and‐stick models. (A) Second zinc finger from ZIF268 mouse intermediate protein (PDB entry 1zaa). (B) Elongation factor TFIIS (PDB entry 1tfi) (C) Zn2Cys6 binuclear cluster from GAL4 (PDB entry 1d66). (D) GATA‐1 chicken erythroid transcription factor (PDB entry 1gat). (E) DNA‐binding module from the glucocorticoid receptor (PDB entry 1gdc).
Figure 17
Figure 17
Binding of zinc‐containing modules to DNA. The zinc atoms are represented by spheres. (A) The three zinc fingers of ZIF268 (PDB entry 1zaa). (B) GATA‐1 transcription factor (PDB entry 1gat). Zn2Cys6 binuclear clusters (C) Gal4 (PDB entry 1d66) and (D) pyrimidine pathway regulator 1 (PPR1) DNA‐binding fragment (PDB entry 1pyi) bound to DNA. (E) Glucocorticoid receptor complexed with DNA (PDB entry 1glu).
Figure 18
Figure 18
Helical DNA binding domains (A) MADS box of serum response factor bound to DNA (PDB entry 1srs). (B) Basic‐region leucine‐zipper (bZIP) c‐Fos/c‐Jun heterodimer complexed with DNA (PDB entry 1fos). Monomers within the dimer are shaded differently. (C) Basic helix‐loop‐helix (bHLH) MyoD homodimeric transcription activator complexed with DNA (PDB entry 1mdy). Monomers within the dimer are colored differently. (D) High‐mobility group (HMG) fragment B from rat (PDB entry 1hme). (E) Structure of a heterodimer of dTAF42 and dTAF62 (PDB entry 1taf). Each monomer contains the histone fold.
Figure 19
Figure 19
β‐sheet DNA‐binding motifs. (A) Arc‐repressor tetramer complexed with DNA (PDB entry 1par). (B) TATA‐box‐binding protein (TBP) complexed with DNA (PDB entry 1ytb). (C) Histone‐like HU protein (PDB entry 1hue). (D) HU‐like IHF complexed with DNA (PDB entry 1ihf). (E) The p53 tumor‐suppressor monomer bound to DNA (PDB entry 1tsr). Regions involved in DNA binding are labeled and colored red. The zinc atoms and side‐chain ligands to the zinc are represented by ball‐and‐stick models. (F) Structure of the p50/p50 homodimer complexed with DNA (PDB entry 1svc). The two insertion regions (magenta) may play a role in binding other transcription factors. (G) Tetrameric complex of NFAT1 (magenta), Fos/Jun (AP‐1), and DNA (PDB entry 1a02). (H) Ternary complex of CBFα (green), CBFβ (magenta), and DNA (blue) (PDB entry 1h9d). (I) Brachyuri T‐domain homodimer bound to DNA (PDB entry 1h6f). (J) STAT‐1 homodimer bound to DNA (PDB entry 1bf5). The coiled‐coil domain, DNA‐binding domain, linker domain, and SH2 domain are colored blue, red, green, and magenta, respectively.
Figure 20
Figure 20
RNP domains. β strands containing the RNP1 or ‐2 consensus sequences are labeled (arrows). (A) U1A splicosomal protein (PDB entry 1urn). (B) Ribosomal protein S6 (PDB entry 1ris). (C) Bacteriophage T4 regA protein (PDB entry 1reg).
Figure 21
Figure 21
The OB fold. (A) Cold‐shock protein A (PDB entry 1mjc). β strands containing RNP1 or ‐2 consensus sequences are colored purple. (B) Cold‐shock protein B (PDB entry 1csp). β strands containing RNP1 or ‐2 consensus sequences are labeled. (C) Ribosomal protein S17 (PDB entry 1rip). (D) Ribosomal protein L14 (PDB entry 1whi). (E) Anticodon‐binding domain of aspartyl‐tRNA synthetase (PDB entry 1asz).
Figure 22
Figure 22
Double‐stranded RNA‐binding domain (dsRBD) and KH domain. (A) Drosophila staufen protein (PDB entry 1stu), an example of dsRBD fold. (B) N‐terminal domain of ribosomal protein S5 (PDB entry 1pkp). (C) Human vigilin (PDB entry 1vih), an example of a KH domain.
Figure 23
Figure 23
(A) The RNA‐binding protein Rop from E. coli. (PDB entry 1rop). Helices 1 and 1′, postulated to bind to RNA, are labeled. (B) Hexamer of the MS2 phage‐coat protein (PDB entry 1mst). Two AB dimers and a CC dimer are arranged around a quasi‐3‐fold rotation axis located in the center of the figure (labeled q3). (C) Eleven‐subunit oligomer of Trp RNA‐binding attenuation protein (TRAP; PDB entry 1wap). Bound tryptophan molecules are shown by a ball‐and‐stick model. Alternating monomers are shaded differently for clarity.
Figure 24
Figure 24
Aminoacyl tRNA transferase catalytic domains (A to B) and signal recognition particle (SRP) domains (C to E). (A) Example of a class I aaRS catalytic domain (GluRS, PDB entry 1gln). The MSK and HIGH motifs are highlighted by green and red respectively. An insertion domain (common in class I catalytic domains) is colored magenta. (B) Example of a class II catalytic domain (HisRS, PDB entry 1htt). Motifs 1 to 3 are colored green, red, and magenta, respectively. (C) Structure of SRP9/14 heterodimer of SRP Alu domain bound to RNA (red coil). SRP9 and ‐14 are colored in green and cyan, respectively (PDB entry 1e8o). (D) Structure of SRP19 in complex with RNA (cyan; PDB entry 1jid). (E) Structure of ffh‐M domain (green) in complex with RNA (red; PDB entry 1dul). (F) Structure of a SRP receptor (PDB entry 1fts). The N domain and I box are both colored magenta.
Figure 25
Figure 25
Lectin folds. (A) Legume lectin soybean agglutinin (PDB entry 1sba). The β strands are labeled A through M. The bound carbohydrate molecules are represented by ball‐and‐stick models. (B) Wheat‐germ agglutinin monomer with bound carbohydrate. Disulfide bonds are shown as yellow sticks. (PDB entry 2wgc). (C) The C‐type lectin mannose‐binding protein A (PDB entry 2msb) with bound carbohydrate. Calcium ions are shown as magenta spheres. (D) S‐lectin with bound carbohydrate (PDB entry 1slt).
Figure 26
Figure 26
Calcium‐binding folds. Calcium ions are drawn as magenta spheres. (A) A pair of calcium‐binding EF‐hands (red and orange respectively) complexed with Ca2+ from bovine calbindin D9K. The corresponding helices are labeled E, F, E′, and F′ (PDB entry 4icb). (B) Calcium‐binding domain of annexin V (PDB entry 1ala).
Figure 27
Figure 27
The classical dinucleotide‐ and mononucleotide‐binding folds shown by ribbon drawings and topology diagrams. In the topology diagrams, the β‐sheets are viewed from the C‐terminal edge with β‐strands represented by green triangles and α‐helices by red circles. Numbers indicate strand and helix order within the structure. Circles containing an “X” represent possible domain insertions. Bound nucleotides are colored purple. (A) Ribbon drawing of the NAD‐binding domain of dogfish lactate dehydrogenase with bound NAD represented as a ball‐and‐stick model (PDB entry 1ldm). (B) Topology diagram for the common core of the classical dinucleotide‐binding fold. (C) Ribbon drawing of adenylate kinase as an example of a mononucleotide‐binding protein (PDB entry 1aky). The portion of the structure that is not part of the nucleotide‐binding fold is colored purple. The bound inhibitor bis(adenosine)‐5′‐pentaphosphate (AP5) is shown using a ball‐and‐stick model. (D) Topology diagram for the common core of the classical mononucleotide‐binding fold.
Figure 28
Figure 28
Structures of DNA and RNA polymerases. (A) The 39‐kDa catalytic domain of rat DNA polymerase β (PDB entry: 1bpd). (B) The Klenow fragment of E. coli DNA polymerase I bound to an 11‐bp duplex DNA in an editing complex (PDB entry: 1kln). The DNA is represented by a yellow and purple phosphate backbone trace. (C) The conserved palm subdomain from Klenow fragment (PDB entry 1kln). (D) The palm subdomain from rat DNA polymerase β (PDB entry 1bpd). (E) Structure of the HIV‐1 reverse transcriptase heterodimer complexed with a 19/18‐base duplex DNA (PDB entry 1hmi). The p66 subunit is colored by subdomain and the p51 subunit is dark blue. The bound DNA is represented by a yellow and purple phosphate backbone trace. (F) Thermus thermophilus RNA polymerase holoenzyme (PDB entry 1iw7). The β′, β, α′, α″, ω, and σ70 subunits are labeled and colored green, cyan, red, tan, magenta, and dark blue, respectively. (G) The N‐terminal domain of the RNAP α subunit from E. coli (PDB entry 1bdf). (H) RNAP II from yeast (PDB entry 1i50). Visible subunits are labeled and the five subunits in common with bacterial RNAP follow the same coloring scheme as in (F).
Figure 29
Figure 29
Structure of the β‐subunit of pol III (PDB entry: 2pol), an example of a sliding‐clamp DNA polymerase processivity factor. (A) A single domain of the β‐subunit. (B) View of the entire ring structure of the homodimer looking down the six‐fold symmetry axis. The two monomers are colored red and green, respectively.
Figure 30
Figure 30
Topoisomerase structures. (A) Structure of the N‐terminal 67 kDa fragment of E. coli topoisomerase I (PDB entry 1ecl). The four domains are labeled and the side chain of the active‐site Tyr319 is represented by a ball‐and‐stick model. (B) Complex of human topoisomerase IB with 22‐bp DNA duplex (PDB entry 1a36). Each domain is color coded and labeled. DNA is a light‐blue ball‐and‐stick model. (C) Same as (B), but rotated 90° around the vertical axis. (D) Structure of the 92‐kDa fragment of yeast topoisomerase IIA showing the organization of domains. (PDB entry 1bgw). (E) Homodimeric form of the 92‐kDa fragment of yeast topoisomerase IIA. For clarity, the two monomers are colored red and green, respectively. (F) Homodimer of the 43‐kDa fragment of E. coli GyrB (PDB entry 1ei1). One monomer is blue‐green, the other is red‐orange. ADPNP bound to each monomer is represented by a ball‐and‐stick model. (G) Homodimer of Methanococcus jannaschii topoisomerase VI subunit A (PDB entry 1d3y). One monomer is colored according to domain and subdomain, the other is gray (program color “white”).
Figure 31
Figure 31
The polynucleotidyl transferase RNase H‐like family of folds. (A) Structure of RNase H from E. coli (PDB entry 2rn2) and (B) Corresponding secondary structure topology. (C) The secondary structural topology of HIV integrase.
Figure 32
Figure 32
Structures containing the actin fold (A to D) and structures that bind to actin (E to G). (A) Actin complexed with ATP (PDB entry 1atn). Domains 1 and 2 are colored purple and blue, respectively. Subdomains 1 to 4 are labeled. ATP is shown as a ball‐and‐stick model. (B) The N‐terminal fragment of heat‐shock cognate protein (hsc70) complexed with ADP (PDB entry 1nga). ADP is shown as a ball‐and‐stick model. (C) Hexokinase B in its open form (PDB entry 2yhx). Structures of (D) glycerol kinase (PDB entry 1gla), (E) profilin (PDB entry 2btf), and (F) severin (NMR structure, PDB entry 1svq). (G) The spectrin repeat is shown as a dimer (PDB entry 1spc), with the two monomers colored red and blue, respectively.
Figure 33
Figure 33
(A) Structure of acetylcholinesterase from Torpedo Californica. The central eight‐stranded β‐sheet is shown in green. (PDB entry 1ack). (B) Diagram of the secondary structure topology common to all α/β hydrolases. The strands are numbered from one to eight and helices are labeled A through F. (C) Structure of an influenza virus neuraminidase complexed with an inhibitor (PDB entry 1nnc). The active site‐bound inhibitor is shown as ball‐and‐stick model.
Figure 34
Figure 34
The TIM‐barrel (A to C) and serine protease fold (D to F). The side chains of residues in the active site catalytic triad are shown as ball‐and‐stick models in panels (D) and (F). (A) Side view of a ribbon drawing of triose phosphate isomerase as an example of a TIM‐barrel. (B) Ribbon drawing of triose phosphate isomerase viewed from the top. (C) Secondary structure schematic of the classical TIM‐barrel fold. β‐strands are represented by green arrows and α‐helices by red rectangles. (D) Structure of the trypsin‐like serine protease, collagenase (PDB entry 1hyl). (E) Structure of the subtilisn serine protease, subtilisn BPN′ (PDB entry 1sup). (F) The structure of the serine carboxypeptidase, wheat serine carboxypeptidase II (PDB entry 1wht).
Figure 35
Figure 35
Examples of cysteine proteases (A and B), aspartic proteases (C and D), and metalloproteases (E to G). The side chains of critical active site residues mentioned in the text are shown as ball‐and‐stick models. Zinc atoms are shown as magenta balls. (A)The papain‐like cysteine protease, human cathepsin B (PDB entry: 1huc). (B) Interleukin‐1b converting enzyme (ICE; PDB entry: 1ice). (C) Pepsin‐like protease, human renin (PDB entry 1bbs). (D) The retroviral protease, HIV‐1 protease (PDB 1hpx). (E) Structure of a zinc‐dependent endopeptidase, a metzincin, snake venom adamalysin II (PDB entry 1iag). (F) Structure of a zinc‐dependent exopeptidase, aminopeptidase from Aeromonas proteolytica (PDB entry 1amp). (G) Structure of alkaline protease, a metzincin from Pseudomonas aeruginosa (PDB entry 1akl). The active site zinc and coordinated side chains are shown as ball‐and‐stick models in the N‐terminal catalytic domain (left side). Bound calcium ions are shown as black balls in the C‐terminal parallel β‐roll domain (right side). (H) A catalytic β‐subunit from the 20S yeast proteasome as a representative of the Ntn fold (PDB entry 1ryp). The nucleophilic threonine is shown as a ball‐and‐stick model.
Figure 36
Figure 36
Enzymes of the ubiquitin pathway. (A) The structure of ubiquitin (PDB entry 1ubq). (B) Complex between the ubiquitin‐conjugating E3 enzyme c‐Cbl (cyan) and the E2 enzyme UbcH7 (green; PDB code 1fbv). The c‐Cbl RING domain is colored magenta with Zn shown as yellow balls and the c‐Cbl‐bound ZAP‐70 peptide is shown in red. The active site Cys86 of UbcH7 is shown as a yellow ball‐and‐stick model. (C) SUMO E2 enzyme Ubc9 with active site Cys93 shown as a yellow ball‐and‐stick model (PDB entry 1kps). (D) Siah homodimer (PDB entry 1k2f). The monomers are colored blue and green, respectively. The RING domains are in orange. Zinc atoms are magenta spheres. (E) Cul1‐Rbx1‐Skp1‐F‐box‐Skp2 complex. The Cul1, Ring‐Box, SKP1, and Skp2‐F‐box are colored in cyan, red, orange, and magenta, respectively (PDB code 1ldk). Zn ions are shown as yellow spheres. (F) The second cullin repeat from cul1 (PDB entry 1ldk).
Figure 37
Figure 37
Structures showing the fold of (A) cytochrome P450‐CAM (PDB entry 1phc), (B) cytochrome c (PDB entry 1ycc), (C) cytochrome c3 (PDB entry 2cy3) with the four heme molecules colored differently, (D) cytochrome b5 (PDB entry 1cyo), (E) cytochrome b562 (PDB entry 1cgn), and (F) a dimer of bacterioferritin (also known as cytochrome b1; PDB entry 1bcf). The heme molecules are shown by ball‐and‐stick models.
Figure 38
Figure 38
Structures of globin‐like proteins from each of the three globin‐like families. All three proteins are shown in the same orientation with respect to the globin fold. Helices that are not considered part of the core globin fold are colored green. (A) Sperm whale myoglobin (PDB entry 1mbd). Helices are labeled A to H according to traditional globin nomenclature. Helices A, E, and F are colored red, while helices B, G, and H are tan. The heme group is represented by a ball‐and‐stick model. (B) Structure of human deoxyhemoglobin showing all four subunits (PDB entry 1hhb). The heme groups are represented by ball‐and‐stick models. The α subunits are colored red and the β subunits are colored yellow. (C) C‐phycocyanin from cyanobacteria (PDB entry 1cpc). The phycocyanobilin cofactor is represented by a ball‐and‐stick model. (D) Colicin A from E. coli (PDB entry 1col).
Figure 39
Figure 39
Tertiary folds of toxins. (A) ADP ribosylation domain of diphtheria toxin (PDB entry 1ddt). (B) Pentameric B domain of bacteria AB5 cholera toxin with each domain colored differently (PDB entry 1chp). (C) Superantigen toxin (PDB entry 1se2). (D) Ricin A chain (PDB entry 1rtc) The structure of (E) scorpion toxin (PDB entry 1mtx), (F) snake toxin (PDB entry 1nxb), and (G) spider toxin (PDB entry 1eit). Disulfide bonds are represented by yellow stick models.
Figure 40
Figure 40
Structure of anthrax toxin. (A) Domains I through IV of the lethal factor (LF) are colored in blue, green, yellow, and orange, respectively (PDB entry 1jky). The bound MAPKK peptide is shown in red. This PDB entry does not include coordinates for the Zn atom. (B) The structure ofedema factor (EF; PDB entry 1k8t). The catalytic domains CA and CB are shown in blue and cyan, respectively. The helical domain and the switch A and C regions are shown in green, yellow, and magenta, respectively. The location of switch B is shown in the next panel. (C) CaM complexededema factor (PDB entry 1k90). The coloring scheme is the same as (B) with CaM in red and switch B in orange. (D) Domains I to IV of the protective antigen (PA) are shown in blue, green, yellow, and red, respectively (PDB entry 1acc). Ca2+ ions are shown as magenta spheres.
Figure 41
Figure 41
Lipid‐binding proteins with respective ligands shown as ball‐and‐stick models. (A) Human retinol‐binding protein bound to retinol (PDB entry 1rbp), an example of a lipocalin. (B) Rat intestinal fatty acid‐binding protein bound to palmitate (PDB entry 2ifb). (C) Human serum albumin with five bound myristate molecules (PDB entry 1bj5). Note that a helix spans both the I/II and II/III domain boundaries. This results in 28 instead of 30 helices in the structure.
Figure 42
Figure 42
Chaperonin and myosin structures. (A) The GroEL/GroES complex viewed from the side (left) and top (right; PDB entry 1aon). The GroEL trans ring is green, the cis ring is blue, and the GroES ring is magenta. The domain structure of GroEL in the (B) trans and (C) cis rings of the GroEL/GroES complex (PDB entry 1aon). The equatorial domains are blue, the intermediate domains are green, and the apical domains are red. ADP is shown as a ball‐and‐stick model. (D) The GroES subunit (PDB entry 1aon). (E) The structure of the scallop myosin subfragment S1 (PDB entry 1b7t). Bound Ca2+ is shown as a small purple sphere. The heavy‐chain domain is shown in green. The essential and regulatory light chains are colored blue and red, respectively.
Figure 43
Figure 43
G‐protein and its regulators. The bound Mg2+ and GDP are shown as a magenta sphere and ball‐and‐stick model. (A) Structure of p21Ras (PDB entry 1gnr). A nonhydrolyzable GTP analog is shown as a ball‐and‐stick model. (B) The structure of the Ras GTPase activation domain of a human p120GAP (PDB entry 1wer). (C) The structure of Ras in complex with the Ras guanine‐nucleotide‐exchange‐factor region of Sos (PDB entry 1bkd). Ras and Sos are colored in green and blue, respectively. (D) The structure of RhoA (green) in complex with RhoGAP (blue; PDB entry 1tx4). GDP and AIF4 are shown as ball‐and‐stick models. (E) The structure of GBP1 (PDB entry 1f5n). (F) Side and (G) top view of the structure of a heterotrimeric G‐protein complex (PDB entry 1got). The G‐G chimera is in red, Gτβ is green, and Gτγ subunit is blue. (H) The structure of RGS4 (blue) in complex with G‐GDP‐AlF4 (green; PDB entry 1agr). (I) The crystal structure of a Gαi‐GDP (green and yellow) bound to the GoLoco region of RGS14 (blue; PDB entry 1kjy). GDP is shown as a ball‐and‐stick model.
Figure 44
Figure 44
Structure of the F1ATPase. (A) Top view of bovine F1ATPase α (yellow), β (red), and γ (magenta, N‐ and C‐terminal helices only) subunits (PDB entry 1e76). (B) Side view of bovine mitochondrial F1ATPase showing one α subunit (left), one β subunit (right), and the γ (magenta, center), δ (cyan, bottom), and ε (green, bottom) subunits. The α and β subunits are each color coded by domain: N‐terminal β‐barrel is cyan, the central nucleotide‐binding domain is green, and the C‐terminal α‐helical bundle is red. (C) Cα model of ten c subunits from a yeast F0ATPase membrane domain (PDB entry 1qo1). Each subunit is a long α‐helical hairpin.
Figure 45
Figure 45
The 20S proteasome from yeast complexed with the 11S regulator from T. brucei (PDB entry 1fnt). The α, β, and regulator subunits are colored red, green, and blue, respectively. (A) Side view of the barrel‐shaped complex. (B) View of the complex looking down the axis of the barrel.
Figure 46
Figure 46
Viral capsid proteins. (A) Illustration of an icosahedron showing two‐, three‐, and five‐fold symmetry. (B) Structure of the jelly‐roll β‐sandwich fold of satellite tobacco necrosis virus‐coat protein (PDB entry 2stv).
Figure 47
Figure 47
Structures of integral membrane proteins. (A) Photosynthetic reaction center (PDB entry 1prc). The four protein subunits are shown: cytochrome (gray), M (green), L (red), and H (yellow). (B) The structure of Halobacterium salinarum bacteriorhodopsin (PDB entry 1c3w), with the cytoplasmic face at the top. The retinal chromophore is shown as a blue ball‐and‐stick model. (C) Rhodopsin from the outer segment of bovine rod photoreceptor cells (PDB entry 1f88). The receptor is shown with the C‐terminal (cytoplasmic) domain at the top, and the N‐terminal (extracellular) domain at the bottom of the diagram. The covalently linked eleven‐cis‐retinal ligand is shown as a blue ball‐and‐stick model. The additional eighth helix is colored in yellow. (D) The ClC chloride channel from Salmonella typhimurium (PDB entry 1kpl). The double barrel of the homodimer is shown with Cl ions, visible in the pores, displayed as green spheres. View is perpendicular to the plane of the membrane with the two subunits colored red and blue. (E) The E. coli vitamin B12 transporter BtuCD. The dimer is depicted, with BtuC subunits in red and BtuD subunits in blue (PDB entry 1l7v). (F) Calcium ATPase from skeletal‐muscle sarcoplasmic reticulum in the E1 state with bound calcium ions displayed as orange spheres. The three cytoplasmic domains are at the top (PDB entry 1eul). (G) Bovine AQP1 water channel monomer (PDB entry 1j4n). View is from the plane of the membrane with the extracellular face at the top. The two membrane‐inserted helices that do not span the membrane are colored in blue. (H) Bovine cytochrome bc1complex (PDB entry 1bgy). The subunits with membrane‐spanning portions are colored in the following scheme. Cytochrome b is red, cytochrome c1 is aqua, Rieske iron‐sulfur protein is blue, subunit 7 is orange, subunit 10 is green, and subunit 11 is yellow. (I) The E. coli ferric enterobactin receptor FepA (PDB entry 1fep). The β‐barrel domain is shown in green and the N‐terminal plug domain is shown in red. (J) TolC outer membrane protein of E. coli (PDB entry 1ek9). The trimer is shown with the subunits colored separately.

Similar articles

Cited by

References

    1. Abrahams, J.P. , Leslie, A.G. , Lutter, R. , and Walker, J.E. 1994. Structure at 2.8 Å resolution of F1‐ATPase from bovine heart mitochondria. Nature 370:621‐628. - PubMed
    1. Adams, M.J. , Ford, G.C. , Koekoek, R. , Lentz, P.J. , McPherson, A. Jr. , Rossmann, M.G. , Smiley, I.E. , Schevitz, R.W. , and Wonacott, A.J. 1970. Structure of lactate dehydrogenase at 2‐8 Å resolution. Nature 227:1098‐1103. - PubMed
    1. Aggarwal, A.K. , Rodgers, D.W. , Drottar, M. , Ptashne, M. , and Harrison, S.C. 1988. Recognition of a DNA operator by the repressor of phage 434: A view at high resolution. Science 242:899‐907. - PubMed
    1. Albert, A. , Yenush, L. , Gil‐Mascarell, M.R. , Rodriguez, P.L. , Patel, S. , Martinez‐Ripoll, M. , Blundell, T.L. , and Serrano, R. 2000. X‐ray structure of yeast Hal2p, a major target of lithium and sodium toxicity, and identification of framework interactions determining cation sensitivity. J. Mol. Biol. 295:927‐938. - PubMed
    1. Alden, R.A. , Birktoft, J.J. , Kraut, J. , Robertus, J.D. , and Wright, C.S. 1971. Atomic coordinates for subtilisin BPN′ (or Novo). Biochem. Biophys. Res. Commun. 45:337‐344. - PubMed

LinkOut - more resources