. 2008 Jun;99(6):1109-16.
doi: 10.1111/j.1349-7006.2008.00809.x. Epub 2008 Apr 21.

Resveratrol induces apoptosis in K562 (chronic myelogenous leukemia) cells by targeting a key survival protein, heat shock protein 70

Affiliations

Resveratrol induces apoptosis in K562 (chronic myelogenous leukemia) cells by targeting a key survival protein, heat shock protein 70

Prabir K Chakraborty et al. Cancer Sci. 2008 Jun.

Abstract

Chronic myelogenous leukemia (CML) is a myeloproliferative disease associated with a characteristic chromosomal translocation called the Philadelphia chromosome. This results in the expression of the Bcr-Abl fusion protein, a constitutively active protein tyrosine kinase. Although there are a few treatment options with Bcr-Abl kinase inhibitors, drug resistance is often encountered. One of the major obstacles in overcoming drug resistance in CML is the high endogenous levels of heat shock protein 70 (Hsp70). Resveratrol is a phytoalexin produced by several plants. We studied the chemotherapeutic effects and mode of action of resveratrol on K562 (CML) cells. Resveratrol induced apoptosis in K562 cells in a time-dependent manner. This was established by increased annexin V binding, corroborated with an enhanced caspase-3 activity and a rise in the sub-G(0)/G(1) population. Resveratrol treatment also caused suppression of Hsp70 both in mRNA and protein levels. The downregulation of Hsp70 by resveratrol exposure was correlated with a diminished presence of heat shock factor 1 (HSF1) in the nucleus, and the downregulation of transcriptional activity of HSF1. High endogenous levels of Hsp70 have been found to be a deterrent for sensitivity to chemotherapy. We show here that resveratrol could considerably enhance the apoptosis induction in K562 cells by 17-allylamino-17-demethoxygeldanamycin, an anticancer agent that inhibits Hsp90 but augments Hsp70 levels. We conclude that resveratrol significantly downregulated Hsp70 levels through inhibition of HSF1 transcriptional activity and appreciably augmented the pro-apoptotic effects of 17-allylamino-17-demethoxygeldanamycin.


Figures

Figure 1
Figure 1
Dose–response of resveratrol‐induced inhibition of heat shock protein 70 (Hsp70) levels in K562 chronic myelogenous leukemia cells. (a) The upper panel depicts Hsp70 protein levels after treatment for 48 h with various doses of resveratrol. The lower panel shows loading control β‐actin levels. The numbers at the bottom represents Hsp70/Actin protein band densities (normalized to control). The blots are representative of three separate experiments. (b) The upper panel depicts Hsp70 mRNA levels after treatment for 48 h with various doses of resveratrol. The lower panel shows loading control β‐actin levels. The numbers at the bottom represents Hsp70/actin mRNA band densities (normalized to control). The blots are representative of two separate experiments.
Figure 2
Figure 2
Effect of resveratrol on heat shock protein 70 (Hsp70) protein and mRNA levels in K562 chronic myelogenous leukemia cells. (a) Hsp70 protein levels. Upper panel depicts a Western blot showing Hsp70 protein levels in K562 cells after resveratrol exposure for 24, 48, and 72 h. The Hsp protein is recognized by an antibody against human Hsp70. The middle panel shows a β‐actin immunoblot to indicate equal protein loading. The Western blots are representative of three separate experiments. The lower panel displays the ratio (mean ± SD) of the Hsp70 protein/actin protein band densities from two experiments. (b) Hsp70 mRNA levels. Upper panel depicts mRNA levels of Hsp70 in K562 cells after resveratrol exposure for 24, 48, and 72 h. The middle panel shows β‐actin mRNA to indicate equal loading. The gels are representative of two separate experiments. The lower panel displays the ratio (mean ± SD) of the Hsp70 mRNA/actin mRNA band densities from two experiments. (c) Hsp70 protein levels in KU812 and KCL22 human chronic myeloid leukemia cells. Upper panel depicts Hsp70 levels and lower panel shows β‐actin levels indicatiing equal loading. KCL, untreated KCL22 cells; KCLR, KCL22 cells after 72 h of treatment with 40 µM resveratrol; KU, untreated KU812 cells; KUR, KU812 cells after 72 h of treatment with 40 µM resveratrol.
Figure 3
Figure 3
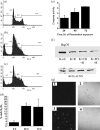
Apoptosis induced by 40 µM resveratrol in K562 chronic myelogenous leukemia cells. (a–c) Cell cycle analysis of K562 cells by flow cytometry. (a) Cell cycle analysis of control (0 h) K562 cells, cells treated with resveratrol for 48 h (b), and cells treated with resveratrol for 72 h (c). M1, sub‐G0/G1; M2, G1; M3, S; M4, G2 phase of the cell cycle. (d) Percentage of cells in sub‐G0/G1 (fragmented DNA), as determined by flow cytometry, after 0 h, 48 h, and 72 h of resveratrol treatment. Data are presented as mean ± SD from two or three separate experiments. (e) Caspase‐3 activity after K562 cells were exposed to resveratrol, presented as the fold increase over control levels (mean ± SD) from two separate experiments. (f) Western blot analysis of heat shock protein 70 (Hsp70). Upper panel, Hsp70; lower panel, β‐actin indicating equal loading. K‐ctl, untreated K562 cells; K+C3I+R, K562 cells pretreated for 1 h with caspase‐3 inhibitor and further treated with both inhibitor and 40 µM resveratrol for 72 h; K+PCI+R, K562 cells pretreated for 1 h with general caspase inhibitor and further treated with both inhibitor and 40 µM resveratrol for 72 h; K+R, K562 cells treated for 72 h with 40 µM resveratrol. (g) Confocal micrographs of annexin V binding to K562 cells after exposure to resveratrol for 72 h. 1, Control annexinV–fluorescein‐isothiocyanate (FITC); 2, differential interference contrast of the same field as 1; 3, 72 h resveratrol treated annexinV–FITC; 4, differential interference contrast of the same field as 3.
Figure 4
Figure 4
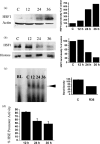
Heat shock factor 1 (HSF1) cellular localization, HSF1 binding to heat shock element (HSE), and HSE promoter activity in K562 chronic myelogenous leukemia cells after treatment with resveratrol. (a) Upper left panel, cytoplasmic localization of HSF1 at different time points after resveratrol treatment. Lower left panel, β‐actin immunoblot to indicate protein loading. Right‐hand panel, cytoplasmic HSF1 band densities of control and resveratrol treated K562 cells expressed as percentage of control. Control has been taken as 100%. The blot is representative of two separate experiments. (b) Upper left panel, nuclear localization of HSF1 at different time points after resveratrol treatment. Lower left panel, histone 2B immunoblot to indicate equal protein loading. Right‐hand panel, nuclear HSF1 band densities of control and resveratrol treated K562 cells expressed as percentage of control. Control has been taken as 100%. The blot is representative of two separate experiments. (c) Left panel, electrophoretic mobility shift assay. Arrow indicates HSF1–HSE binding. 12, nuclear extract of K562 cells treated with resveratrol for 12 h; 24, nuclear extract of K562 cells treated with resveratrol for 24 h; 36, nuclear extract of K562 cells treated with resveratrol for 36 h; BL, blank without nuclear extract; C, control. Right‐hand panel, HSF1–HSE binding band densities of control and K562 cells treated with resveratrol for 36 h (R36). Representative of two separate experiments. (d) HSE promoter activity. Data are presented as mean ± SD of percentage of control HSE promoter activity from two or three experiments. The secreted alkaline phosphatase assay fluorescence value for untreated control K562 cells were taken as 100%. Details of the experimental procedure are given in the Materials and Methods section.
Figure 5
Figure 5
Combined activity of anticancer drug 17‐allylamino‐17‐demethoxygeldanamycin (17‐AAG) and resveratrol in K562 chronic myelogenous leukemia cells. (a–d) Cell cycle analysis by flow cytometry of control and 17‐AAG treated K562 cells. (a) Control untreated K562 cells; (b) 1 µM 17‐AAG; (c) 2.5 µM 17‐AAG; (d) 5 µM 17‐AAG. (e–h) Cell cycle analysis by flow cytometry of K562 cells treated for 48 h with 40 µM resveratrol only (e) and with both resveratrol (40 µM) and 17‐AAG at concentrations of 1 µM (f), 2.5 µM (g), or 5 µM (h). M1, sub‐G0/G1; M2, G1; M3, S; M4, G2 phase of the cell cycle. (i) Percentage of sub‐G0/G1 cells in K562 cells treated with 17‐AAG and resveratrol. Data are presented as the mean ± SD of three or four separate experiments. The cells were subjected to the treatments detailed above for a period of 48 h.
Figure 6
Figure 6
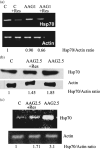
Heat shock protein 70 (Hsp70) status of K562 chronic myelogenous leukemia cells treated with 17‐allylamino‐17‐demethoxygeldanamycin (17‐AAG) and resveratrol. (a) Upper panel, Hsp70 mRNA levels in K562 cells treated with 1 µM 17‐AAG and 40 µM resveratrol; lower panel, β‐actin levels in K562 cells treated with 1 µM 17‐AAG and 40 µM resveratrol. C, control; C+Res, K562 cells treated with resveratrol; AAG1, 1 µM 17‐AAG; AAG1+Res, resveratrol and 1 µM 17‐AAG. Ratio of Hsp70/β‐actin mRNA (normalized to control) is presented as the mean of data from two separate experiments. (b) Upper panel, Hsp70 protein levels in K562 cells treated with 2.5 µM 17‐AAG and 40 µM resveratrol; lower panel, β‐actin levels in cells treated with 2.5 µM 17‐AAG and 40 µM resveratrol. C, control; AAG2.5, 2.5 µM 17‐AAG; AAG2.5+Res, resveratrol and 2.5 µM 17‐AAG. Ratio of Hsp70/β‐actin protein (normalized to control) is presented at the bottom. The scan is representative of two separate experiments. (c) Upper panel, Hsp70 mRNA levels in 2.5 µM 17‐AAG and 40 µM resveratrol treated K562 cells; lower panel, β‐actin mRNA levels in 2.5 µM 17‐AAG and 40 µM resveratrol treated K562 cells. C, control; AAG 2.5, 2.5 µM 17‐AAG; AAG2.5+Res, resveratrol and 2.5 µM 17‐AAG. Ratio of Hsp70/β‐actin mRNA (normalized to control) is presented at the bottom. The cells were subjected to the treatments mentioned above for a period of 48 h. The scan is representative of two separate experiments.
Figure 7
Figure 7
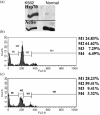
Status of heat shock protein 70 (Hsp70) levels in normal non‐adherent white blood cells (WBC) and the effect of resveratrol on sub‐G0/G1 DNA in these cells. (a) Western blot of Hsp70 protein in K562 chronic myelogenous leukemia cells and normal non‐adherent WBC. Upper panel, Hsp 70 protein levels; lower panel, β‐actin levels. (b,c) Cell cycle analysis by flow cytometry of normal non‐adherent WBC with (c) or without (b) 40 µM resveratrol exposure. M1, sub‐G0/G1; M2, G1; M3, S; M4, G2 phase of the cell cycle.

Similar articles

Cited by

References

    1. Deininger MWN, Goldman JM, Melo JV. The molecular biology of chronic myeloid leukemia. Blood 2000; 96: 3343–56. - PubMed
    1. Bedi A, Barber JP, Bedi GC et al . BCR‐ABL‐mediated inhibition of apoptosis with delay of G2/M transition after DNA damage: a mechanism of resistance to multiple anticancer agents. Blood 1995; 86: 1148–58. - PubMed
    1. Amarante‐Mendes GP, Kim CN, Liu L et al . Bcr‐Abl exerts its antiapoptotic effect against diverse apoptotic stimuli through blockage of mitochondrial release of cytochrome C, activation of caspase‐3. Blood 1998; 91: 1700–5. - PubMed
    1. Kharas MG, Fruman DA. ABL oncogenes and phosphoinositide 3‐kinase: mechanism of activation and downstream effectors. Cancer Res 2005; 65: 2047–53. - PubMed
    1. Sánchez‐Arévalo Lobo VJ, Aceves Luquero CI, Álvarez‐Vallina L et al . Modulation of the p38 MAPK (mitogen‐activated protein kinase) pathway through Bcr/Abl: implications in the cellular response to Ara‐C. Biochem J 2005; 387: 231–8. - PMC - PubMed

MeSH terms